Okay Zed and Cyrus Forbes / 文章
三个多月里,回归工作流跟了1700多起调查,定位了600多起根因
OpenAI的Performance Factory用云端Codex调查性能回退并起草修复,合并与否仍由工程师决定。人工抽查100条根因建议,70%被评为准确。
乔木改写
三个多月里,OpenAI的回归工作流跟了1700多起性能调查,把其中600多起定位到了根因。按这篇2026年11月19日的工程博客来算,大约每天17起自动调查。
写这篇文章的是OpenAI技术员工Okay Zed和Cyrus Forbes。他们把这套系统叫做Performance Factory。它在云端运行,用Codex和公司的模型去查找、处理性能回退。工作流会在告警触发后打开任务,由智能体调查并起草修复,再交给工程师审阅;部署之后,另一个智能体再检查性能有没有回到基线。
查到根因是一回事,把修复做对是另一回事。官方写,真正难的是后面这一步。
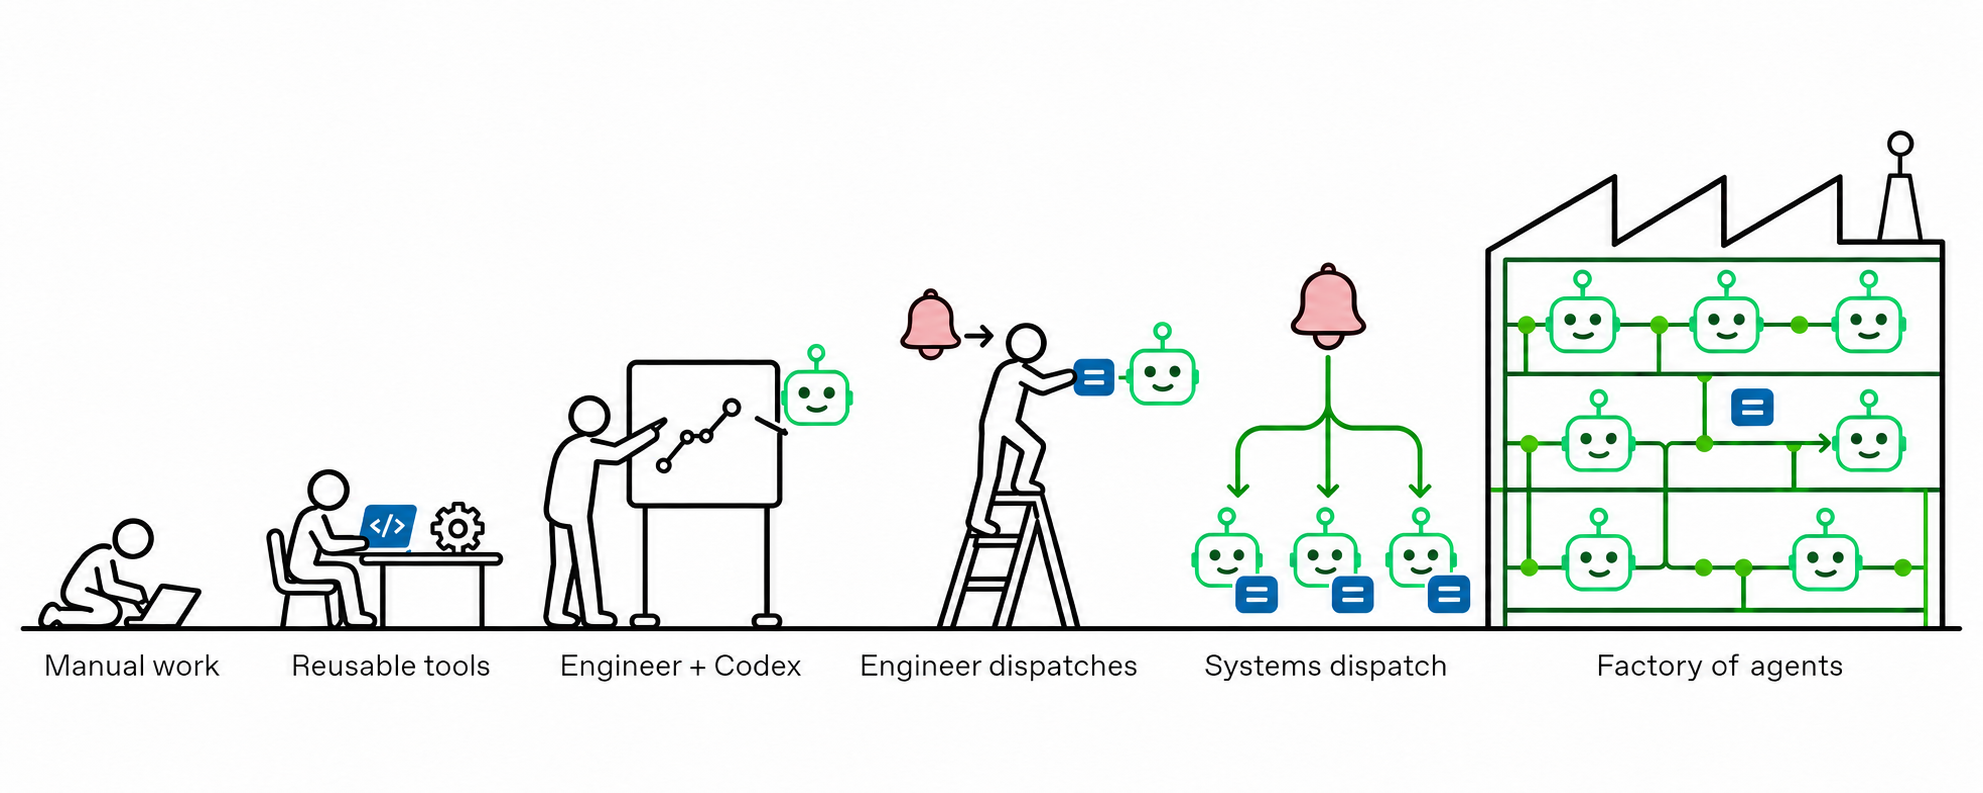
从手动查日志,到告警直接在云端启动Codex
团队把更多性能工作交给Codex之后,工作方式一步步发生了变化。两位作者写,其他服务团队如果要在别的领域采用智能体工作流,也可以参考这个过程。
媒体未能载入,请通过下方原文链接查看。
在Codex出现之前,工程师要自己看指标和日志,对比追踪,调试正在跑的机器,并读代码来查一次变慢。同样的问题如果反复出现,比如ChatGPT首个token延迟回退,他们就会做更专门的工具。时间一长,性能工具积累到了30多种。
有了Codex当搭档之后,工程师可以问「为什么这次变慢了」,即使对系统不熟,也可以一起查。Codex能搜大型代码库,找相关指标和追踪,顺着服务之间的调用往下走,并做相应的性能分析。不过,调查过程仍要人来把握:该用哪些性能工具、下一步往哪引,还是工程师在定。
为了再往前走一步,他们把性能团队的调查过程写成一个共享技能,叫做perf-forensics。它告诉Codex有哪些工具、什么时候该用,以及遇到变慢该从哪些角度下手:变慢是从什么时候开始的,影响到了哪些请求,部署或配置变更能不能解释这件事。
他们用过去的回退做评测,反复改这个技能。对关注的那些回退类型,比如ChatGPT延迟和可用性下降,已经可以只把告警交给Codex,在一轮里拿到诊断,不必逐步人肉带路。
再往后,工程师开始觉得自己像告警和Codex之间的传话人:告警一来,就把内容连同对应技能贴进Codex,再把结果贴回Slack。
于是调查被搬到了云端,告警可以自动启动一轮Codex。Codex会在Slack线程里贴出调查结果,但自动化到这条回复就停了。工程师还得接过诊断、写出修复,并在部署后确认有没有用。告警一多,连判断哪些回退该先看,都要在Slack线程里翻。
他们因此做了Performance Factory,用来跑端到端的性能工程工作流。系统会跟踪每个进行中的任务下一步需要什么,并在这一步就绪时派出智能体。任务自己保存状态和结论,工作可以在智能体和工程师之间交接,代码评审或部署之后也能接着做。一次回退从调查告警开始,到在生产里确认恢复结束。常见的优化也可以做成定期在各服务上跑的工作流。一个工作流如果发现了优化机会,还可以在另一个工作流里打开任务,去测试并实现它。
任务服务、调度循环、云端Codex,以及会把智能体叫醒的订阅
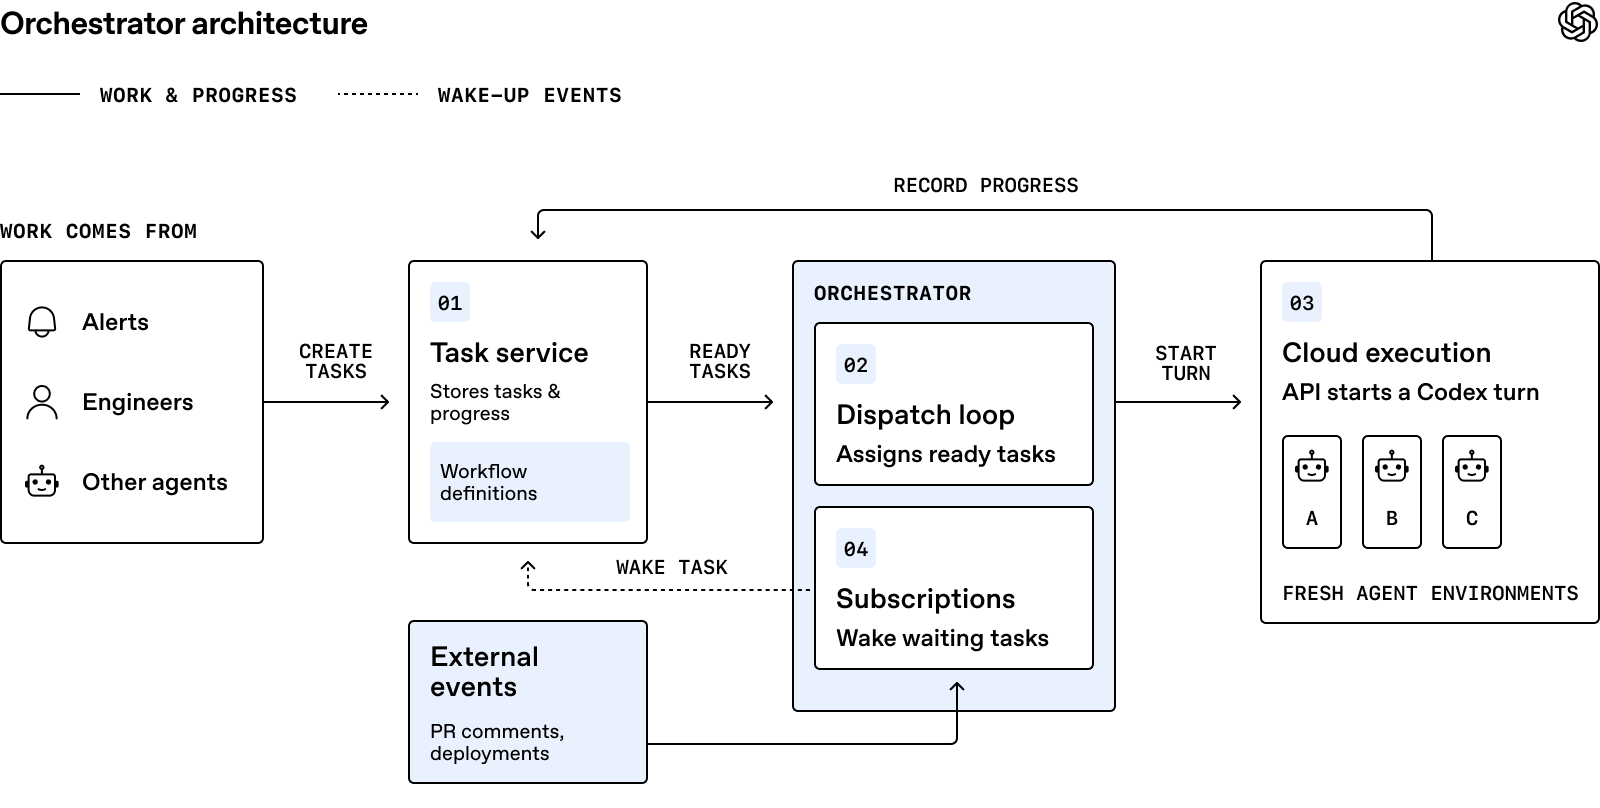
Performance Factory有四个部分:可配置工作流的任务跟踪、把就绪工作分给智能体的调度循环、在云端运行Codex的API,以及在情况变化时叫醒智能体的订阅,比如GitHub上出现了评审意见,或一次部署已经完成。
媒体未能载入,请通过下方原文链接查看。
任务服务里,工程师用配置文件和Markdown提示词定义工作流。配置列出任务可能经过的状态、允许的转换,以及哪些步骤需要工程师。各个步骤该做什么,则写在分开的提示词里。一个代码修改任务里,通常会有配置文件,再配上实现和评审用的Markdown提示。
所有工作流都可以在界面里看到。工程师能看哪些任务还开着,跟上进度,也可以把任务交给更熟悉情况、或更能接下一步的同事。
调度循环会定期检查哪些任务已经可以进入下一步,然后按当前状态的说明启动一轮Codex。智能体把进展写回任务,如果这一步做完了,就把任务推到下一个状态。
任务一旦分出去,智能体需要一个能工作的环境,而且要能用上工程师常用的那些工具。他们做了一个内部API,在云端程序化地启动Codex轮次。这个轮次跑在公司网络内部的环境里,能够访问代码仓库,以及指标、日志、追踪、CPU画像和内存快照等可观测工具。
智能体以服务身份运行,这样可以限制权限,也能分清哪些动作来自性能智能体。把工作放到云端,就可以并行跑调查,不必等某位工程师的笔记本开着,也不必手动管理一台台云开发机。
有些工作必须等人,或等一次部署;这段时间里,智能体不必一直挂着。任务可以订阅事件,比如拉取请求上的评审意见,或失败的持续集成检查。事件一到,任务重新变为就绪,调度循环再派智能体接着做。
回归工作流:从告警到确认恢复
他们在Performance Factory里做的第一个工作流,就是查找、定位并处理回退,名字叫做Regression Workflow。一次性能回退会经过「需要调查」「已定位根因」「已提出修复」「已解决」这几个阶段。自动化工作流按同样的阶段往前推。
配置好的性能告警一触发,工作流就打开一个任务。任务把状态和关键结论记在任何一个智能体的上下文之外,这样其他智能体或工程师都能接手前。工程师可以在Slack或回归工作流界面里跟随进度、补充背景、审阅拟议的改动。修复部署之后,智能体会检查性能是否回到原来的状态,再决定要不要把任务标成已解决。
原文页上还有一张可交互的回归工作流示意图,按检测、查找根因、提出修复、工程师审阅并部署、验证恢复、已解决这六个阶段展开。这次没能把这张组合示意图存成一张单独的静态图,步骤本身已写在正文里,图可以在原文页查看。
定位根因是第一件大事。智能体先弄清哪些指标变差了、是从什么时候开始变的,以及影响到了哪些服务请求。perf-forensics技能给Codex提供性能工程师在用的工具,以及处理这些问题的剧本。
告警往往是在指标越过阈值时才响,回退却可能早几个小时就开始了。智能体会往回看数据,找出指标第一次变差的时间,再比较不同组请求:是同类请求真的变慢了,还是本来就慢的请求变多了。这两种情况,指向的原因不一样。
知道该在何时何地查看之后,智能体会检查部署和功能开关变化,再去读相关代码。它会核对这次变更何时真正到达了受影响的请求,并用日志或追踪来检验,这些代码能不能解释看到的现象。
对抗审查会把站不住的诊断打回去
早期,智能体有时会停在第一个说得通的解释上,而其中一些诊断后来被证明是错的。为了抓住这类错误,他们加了一道对抗审查:另开一轮Codex,专门试图推翻已提出的诊断。审查者会复核假设,并检验反事实。如果一次放量造成了变慢,那么没被放量覆盖的同类请求是否仍然健康?如果把嫌疑变更回滚了,受影响的指标有没有恢复?
有一次调查里,智能体把失败的ChatGPT对话追到了图片下载出错,并标记原因已找到。负责审查的Codex注意到,负责定位文件的内部服务其实已经恢复,图片请求却还在失败。这个诊断解释不了仍在持续的失败,于是审查方重新打开调查,并记下还需要搞清楚的事情。
他们把更大的工作拆成更聚焦的Codex轮次,效果不错。在一次对100条根因建议的人工审阅里,**70%**被评为准确,**30%**还需要再加工,或者没有把因果关系完全立住。在回归工作流里,调查回退、质疑诊断、提出修复,是由不同轮次分开做的,用互相制约来提高准确率。
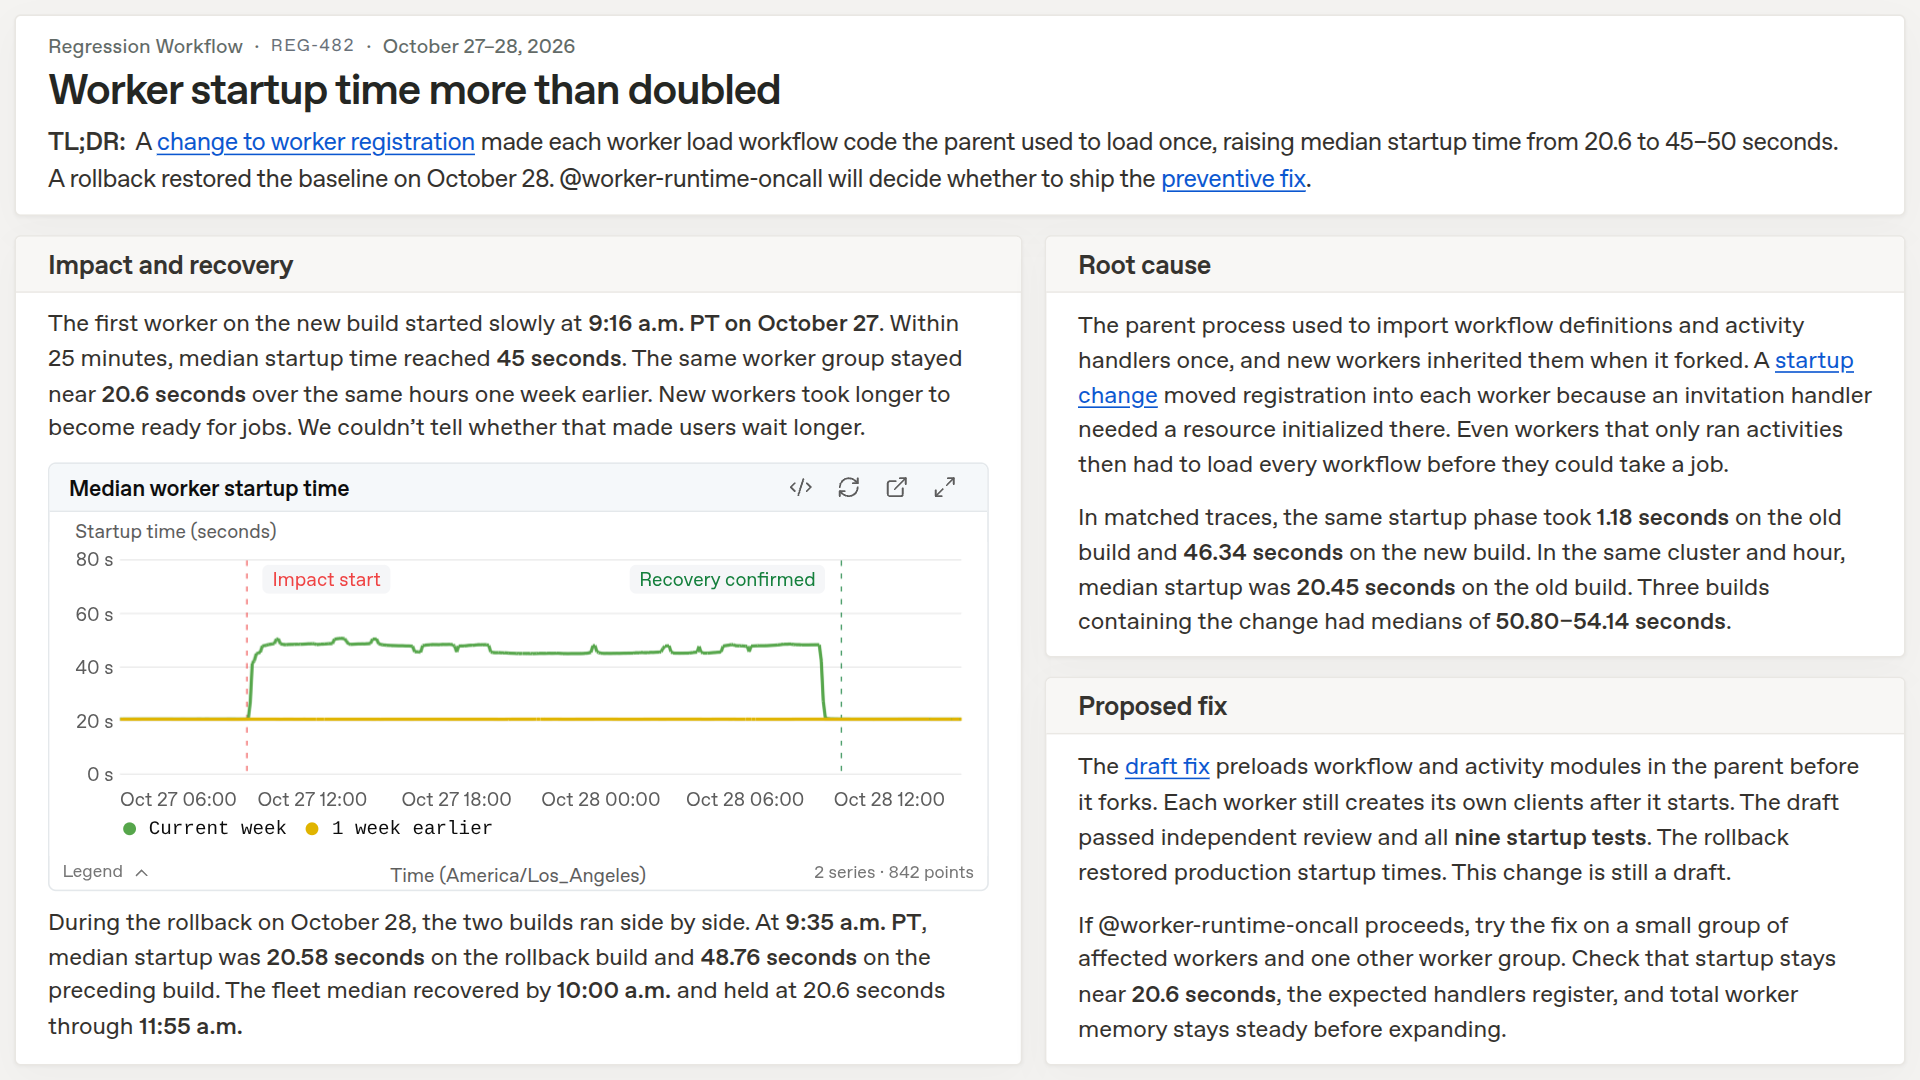
诊断通过对抗审查后,工作流会让Codex实现修复并打开拉取请求。工程师审阅这个请求,再决定是否合并。每个任务都有一份自动生成的报告,汇总回退、影响、根因和拟议修复,并配上指标时间序列、CPU火焰图和追踪,方便工程师快速查看证据。工程师可以直接改这个请求,也可以按诊断自己写修复。如果他们在请求上留言,工作流会叫醒智能体去处理这些意见。
媒体未能载入,请通过下方原文链接查看。
工程师把修复部署之后,工作流会叫醒智能体,检查性能有没有回到此前的基线。如果恢复了,任务就被标成已解决。如果只恢复了一部分,智能体会结束原来的回退,再为剩下的变慢打开一个新任务,因为原因可能已经不同。如果没有任何改善,智能体会记下发生了什么,并把回退送回调查。
把修复做对,比找到原因更难。他们见过智能体提出的改动比需要的更复杂,或引入了新问题。和根因步骤类似,他们也对每个拟议修复加了对抗审查,检查它是否针对根因,并帮助发现缺陷或意外后果。有些修复还涉及更高层的架构决定。比如加缓存可能让性能变好,但会引入过期数据。这类改动更需要熟悉该服务的工程师来权衡取舍。
他们正在用这些案例做评估和改进循环:比较智能体提出的修复和工程师最终合并的改动,看提案短在哪里,再据此做评测、改进工作流。他们也在做合成性能测试,让智能体在请工程师审阅之前,就能测量拟议修复并改一版。他们还在探索,能否用其他智能体评审工具识别低风险改动,并在将来让这些修复在没有人介入的情况下发出去。这仍是正在探索的方向,不是已经上线的做法。
工程师的注意力要留在决策上,智能体自己也要被监控
Codex调查的原始输出,可能是一面很难读的字墙。要看懂智能体在主张什么,还得自己去找图,核对数据是否撑得住。他们希望工程师把注意力花在决策上,而不是花在复原智能体刚做过的工作上。
智能体能调查的回退,比团队来得及读完的更多。第一版界面里堆满了发现,仍要有人决定哪些信息重要。同一次回退,也可能在告警、监控和频道里变成好几起事件。现在的工作流会把相关事件连起来,按团队关心的指标分组,并按估计影响排序。工程师可以专心补充背景、权衡取舍,以及决定什么该发布。
更新调查技能或升级模型,可能让智能体在一些案例上诊断得更好,在另一些案例上变得更差,所以改动前需要先测。他们把两件事分开评估:智能体调查得怎么样,以及它的摘要对工程师是否有用。
调查评估是拿过去的生产事故做回测。这些事故被做成可重复跑的测试集。Codex智能体尝试调查并处理事故,再拿它的行为和当年的实际处理记录对比。每个案例都从新的调查智能体和原始信号开始,并去掉可能直接泄露答案的细节。
历史测试要小心。指标和追踪会过期,恢复之后才收集到的证据,也可能把原因直接暴露出来。测试只有在清楚调查者当时能看到什么证据时才有用。智能体可以在设定限度内检查代码、查询生产遥测,但不能使用以前调查留下的记忆,不能读事故报告,也不能看此前运行的结果。他们事后还会检查记录,看有没有可能把测试作废的信息。
评分包括问题何时开始、影响有多大、哪些请求被影响到,以及智能体如何用证据排列可能原因,并说明还有哪些不确定。智能体可能把时间点找对,却把原因归到错误的一次部署上,所以这两项是分开打分的。
对交给工程师的摘要,他们用已保存任务的快照来评估。这类回测特别合适,因为做摘要并不依赖会过期的外部指标或追踪。另一套评分会检查:一个不熟悉该系统的工程师,能否看懂发生了什么、为什么重要,有用的图有没有留下,以及下一步建议有没有被证据撑住。
智能体本身也要被监控。性能分析器坏了,或少了某个权限,都可能让它无法验证变慢的原因。这类故障在最终报告里不容易看出来,所以他们每天会跑一个智能体,翻最近运行的消息和日志,查找工具失败和访问错误。
他们也用Performance Factory来做自修复。同一种工具错误如果挡住了好几起调查,智能体就会开一个任务来修它。原因清楚时,智能体会提出修复,由工程师审阅并决定是否合并。这类改动合并之后,他们还会用评测检查,智能体是否已经迈过了此前卡住的那一步。
下一步想在告警响起之前就发现变慢
回归工作流只是这种「智能体工厂」模式的一个例子:任务按明确的状态往前走,智能体在下一步就绪时推进,单独的审查者质疑结论,需要判断时再由工程师接手。其他工作流可以复用同一套机制,只换状态、说明和事件。
Performance Factory还可以在工作流之间协调,让一个工作流里的智能体为另一个工作流创建任务。
原文在这段旁边放了一段约19秒的演示视频,说明智能体如何在不同工作流之间创建任务。这段视频嵌在原文页上,这次没有单独转存。
目前,回归工作流是在告警响起后才启动。他们正在做更主动的办法,让系统在没有告警时也能发现变慢或优化机会。设想是:智能体利用已经在收集的细粒度性能数据,对比不同版本的CPU和内存画像、堆转储和请求追踪,也许会注意到某类请求的CPU有一点升高,然后在回归工作流里打开任务,去追原因、实现修复,并提交给工程师审阅。
对已经知道该看什么的情况,他们想把已知信号写成更多工作流。官方举了服务规格调整这个技能为例,它帮助智能体发现自动扩缩容设置让副本跑得比服务需要的更多。一旦能识别这类模式,他们希望在所有服务上定期跑相应的工作流。Performance Factory想做到的是:工程师从一次变慢里学到的东西,几个月后在另一个服务里,也能影响下一次调查和修复。
博客结尾写,下一次你觉得ChatGPT变慢,很有可能Performance Factory已经在查原因了。今天的瓶颈,也许是在等工程师审阅并合并修复。他们已经在探索智能体能否自己做这一步。这是官方对下一步的设想,不是对读者的操作建议。对要做类似系统的团队,这篇里比较能直接拿走的,是把调查、对抗审查和修复拆开,先用历史事故做回测,并且不要把自动调查理解成自动上线。
原文
How OpenAI’s Performance Factory keeps ChatGPT fast
媒体未能载入,请通过下方原文链接查看。
媒体未能载入,请通过下方原文链接查看。
媒体未能载入,请通过下方原文链接查看。
How OpenAI’s Performance Factory keeps ChatGPT fast
November 19, 2026
Our Codex-powered system automates finding and fixing performance issues.
By Okay Zed and Cyrus Forbes, Members of Technical Staff
The staggering pace of agentic development has made traditional approaches to performance engineering unsustainable. To keep up, we built the Performance Factory, an autonomous system that uses the full capabilities of Codex and our models to find and fix regressions at an unprecedented speed. The Performance Factory, which runs in the cloud and automates investigating and resolving performance problems, enables us to keep pace with the ambition of our roadmap.
In the Performance Factory, our engineers define workflows for recurring jobs and write instructions for the Codex agents that carry them out. In particular, the Regression Workflow opens a task when a performance alert fires. An agent investigates the slowdown, records its findings in the task, and proposes a fix for an engineer to review. After deployment, another agent picks up the same task to check whether performance has returned to baseline. From investigating to authoring the fix to verifying mitigation, this first workflow in the Performance Factory has automated the entire process of fixing regressions. In just over three months, the Regression Workflow tracked more than 1,700 investigations and root caused over 600 cases. That’s 17 automated investigations every day.
Here, we’ll share how our use of Codex evolved into what’s now the Performance Factory, walk through our first running workflow, and share early lessons from building and running agent workflows in production.
The path from manual investigations to automated workflows
As we used Codex for more of our performance work, we noticed a progression in how our team worked. We hope other service teams can learn from our process as they adopt agentic workflows in other domains.
Software work evolves from manual labor to partnering with machines to agent factories.
-
Pre-Codex. Before Codex, engineers manually examined metrics and logs, compared traces, debugged live machines, and read code to investigate a slowdown. This work was time consuming, and knowing where to look often required deep knowledge of the service. Relevant signals were easy to miss. When we encountered the same kinds of problems repeatedly—like regressions in ChatGPT’s first token latency—we built advanced tools, like CPU and allocation profilers, to make those investigations easier. Over time, we accumulated more than 30 performance tools.
-
Codex as a partner. Once we had Codex as a partner, engineers could ask, “Why did this get slower?” and work with Codex to investigate, even in an unfamiliar system. Codex could search large codebases, find relevant metrics and traces, follow interactions across services, and do appropriate profiling to piece together what had happened. But engineers still had to steer the process, knowing which performance tools to use and how to guide the investigation. Difficult investigations were more debuggable for more people, with less expertise and time required.
-
Reusable skills. To automate further, we captured our performance team’s investigation process in a shared skill called
perf-forensics. It tells Codex which tools are available, when to use them, and how to work through a slowdown so Codex can try to resolve the problem from a few angles:
- Find when the slowdown began
- Identify the affected requests
- Investigate whether deployments or configuration changes could explain it
We tested and refined the perf-forensics skill using evals based on past regressions. For the types of regressions we focused on (for example, ChatGPT latency and availability drops), we could now give Codex an alert and get back a diagnosis in a single run, without guiding it through each step.
-
The human proxy. As we added and refined perf-related Codex skills like
perf-forensics, we started to feel like a proxy between our alerts and Codex. An alert would fire, and an engineer would simply copy and paste it into Codex with the right skill, then paste the findings back into Slack. -
Automated investigations. Next, we moved investigations to the cloud so an alert could start a Codex session automatically. Codex investigated the slowdown and posted its findings in the Slack thread, but the automation ended with that reply. An engineer still had to pick up the diagnosis, develop a fix, and check whether it worked after deployment. As alerts accumulated, even figuring out which regressions needed attention meant sifting through Slack threads.
-
The factory. We built the Performance Factory to run end-to-end agentic performance engineering workflows. It tracks what each active task needs next and assigns an agent when that step is ready. Each task keeps its state and findings, so work can pass between agents and engineers and resume after a code review or deployment. For a regression, the work starts with investigating an alert and ends with verifying recovery in production. We can turn common optimizations into workflows that run regularly across our services. A workflow that spots a potential optimization can open a task in another workflow to test and implement it.
The Performance Factory system’s four parts
The Performance Factory is made up of four components: a task tracker with configurable workflows, a dispatch loop that assigns ready work to agents, an API that runs Codex in the cloud, and subscriptions that wake agents when something changes (such as a GitHub review comment posting or a deployment completing).
Performance Factory consists of a task service, dispatch loop, cloud execution, and subscriptions.
Task service with configurable workflows
The task service is where engineers define workflows by adding configuration files and prompts for the agents to follow, written in Markdown. The configuration lists the states a task can move through, the allowed transitions, and which steps need an engineer. Separate prompts tell agents what to do at each step.
code-change/
├── config.toml
└── work/
    ├── implementing.md
    └── reviewing.md
A code change task contains a configuration file, along with Markdown prompts for implementing and reviewing.
Each piece of work becomes a task in a workflow, and all workflows are visible in a UI. Engineers can see what’s open, follow progress, and share a task with a teammate who might have more context or be able to help with the next step.
Dispatch loop that assigns work
A dispatch loop periodically checks which tasks are ready for the next step. It assigns an agent to each task by starting a Codex turn with the instructions for the task’s current state. The agent records its progress on the task and moves it to the next state if it completes the step.
Codex in the cloud
Once a task is assigned, the agent needs a place to do the work, with access to the same tools an engineer would use. We built an internal API to programmatically invoke a Codex turn in the cloud. The Codex turn runs on an environment inside our network, with access to our code repositories and the observability tools our engineers use, such as metrics, logs, traces, CPU profiles, and memory snapshots.
The agent runs under a service identity, so we can scope its permissions and see which actions came from our performance agents. Moving agentic work to the cloud lets us run work in parallel without relying on engineers’ laptops being open or manually managing individual cloud development boxes.
Subscriptions that wake the agent when something changes
Some work has to wait for a person or a deployment; an agent shouldn’t have to keep running in the meantime. When a task needs to wait, it can subscribe to events like review comments or failed CI checks on a GitHub pull request to get notified when it’s time to pick the work back up. When an incoming event matches the subscription, the task becomes ready again and the dispatch loop can then assign an agent to continue the work.
The first workflow: from alert to recovery
Finding, root causing, and solving regressions is the first workflow we built inside the Performance Factory. We call it the Regression Workflow. A performance regression moves through several stages: needs investigation, root caused, fix proposed, and resolved, so we built the automated workflow to reflect and move a task through those same stages.
When one of its configured performance alerts fires, the Regression Workflow opens a task that agents pick up and move across these stages. The task records its status and key findings outside of any one agent’s context so that other agents or engineers can pick up the work. Engineers can follow the work in Slack or the Regression Workflow UI, add context, and review proposed changes. After a fix is deployed, an agent checks whether the performance has recovered to its original state before resolving the task.
Performance Factory regression workflow
The original page includes an interactive Regression Workflow diagram. Its steps are: (1) Detected, by the system; (2) Find root cause, by an agent; (3) Propose fix, by an agent; (4) Review and deploy, by an engineer; (5) Verify recovery, by an agent; (6) Resolved. If the system is still regressed after verification, the task goes back to investigation.
The Regression Workflow’s steps include finding the root cause, proposing a fix, reviewing and deploying, and verifying recovery.
Agents find the root cause
Finding the root cause (or causes) is the first major step in the workflow. The agent starts by figuring out which metrics got worse, when they started to change, and which service requests were affected. The perf-forensics skill gives Codex access to the tools our performance engineers use and a playbook for working through those questions.
An alert fires when a metric crosses a threshold, but the regression may have started hours earlier. The agent looks back through the data to find when the metric first got worse. It then compares groups of requests: did similar requests actually get slower, or were we serving more requests that were already slow? Those findings point to different causes.
Once it knows when and where to look, the agent examines deployments and feature flag changes, then reads the relevant code. It checks when a change actually reached the affected requests and uses logs or traces to test whether the code could explain what happened.
Adversarial review strengthens the diagnosis
Early on, agents sometimes stopped at the first plausible explanation they found, and some of those diagnoses turned out to be wrong. To catch these mistakes, we added an adversarial review: a separate Codex session that tries to disprove the proposed diagnosis. The reviewer rechecks the assumptions and tests counterfactuals. If a rollout caused the slowdown, did similar requests that weren’t exposed stay healthy? If the suspected change was rolled back, did the affected metric recover?
In one investigation, an agent traced failing ChatGPT conversations to errors in image downloads and marked the cause as found. The Codex reviewer noticed that the internal service responsible for locating files had already recovered while image requests were still failing. The diagnosis did not explain the continuing failures, so the AI reviewer reopened the investigation and recorded what still needed to be established.
We’ve had success breaking larger jobs into focused Codex turns. In a manual review of 100 root cause suggestions, we graded 70% as accurate, with 30% needing further refinement or not fully establishing causality. In the Regression Workflow, different turns investigate regressions, challenge diagnoses, and propose fixes to increase accuracy numbers through checks and balances.
Fixing the regression is the hard part
Once the diagnosis passes adversarial review, the workflow asks Codex to implement a fix and open a pull request. An engineer reviews the PR and decides whether to merge it. We’ve put a significant amount of work into making this handoff as easy as possible. Each task has a report with an automatically generated summary of the regression, its impact, the root cause, and the proposed fix. We’ve tuned these summaries to be easy to scan, including metrics time series, CPU flame graphs, and traces to help engineers quickly understand the findings and inspect the evidence. Engineers can edit the PR directly or use the diagnosis to write their own fix. If they leave comments on the PR, the workflow wakes an agent to address them.
An example task report for a regression shows key details, root cause, and proposed fix.
After an engineer deploys the fix, the workflow wakes an agent to check whether performance has returned to its earlier baseline. If it has, the agent marks the task as resolved. If performance has only partially recovered, the agent resolves the original regression and opens a new task for the remaining slowdown, which may have a different cause. If there’s no improvement, the agent records what happened and sends the regression back for investigation.
Getting fixes right has been harder than finding the cause. For example, we’ve seen cases where the agent-proposed changes are more complicated than necessary or introduce new issues. Similar to the root cause step, we added an adversarial review of each proposed fix to check whether they address the root cause and help catch bugs or unintended consequences. Some fixes also require higher level architectural decisions. For example, adding a cache might improve performance but introduce stale data. Changes like these benefit from guidance from an engineer who knows the service and can weigh the tradeoffs.
We’re building an evaluation and improvement loop using these cases. By comparing the fixes agents propose with the changes engineers ultimately merge, we can better understand where proposals fall short, build evals, and improve the workflow. We’re also working on using synthetic performance tests so agents can measure proposed fixes and revise them before asking an engineer for review. We’re also exploring how agents could use our other agentic review tools to identify low-risk changes and eventually ship those fixes without a human in the loop.
What we learned
Building and running the Performance Factory has taught us a lot about developing and operating agent workflows in production. Here are some lessons for teams building their own agentic workflows.
Protect engineers’ attention
The raw output from a Codex investigation can be a wall of text that’s hard to parse. It takes effort to figure out what the agent is claiming and track down the graphs to see whether the data backs it up. We want engineers to spend their attention on decisions rather than reconstructing the agent’s work.
Agents can investigate more regressions than a team has time to read about. Our first version gave engineers a UI full of findings, but someone still had to decide which information mattered. One regression can also appear as several incidents across alerts, monitors, and channels. The workflow now links related incidents, groups them by the metrics teams care about, and ranks their estimated impact. Engineers can focus on adding context, weighing tradeoffs, and deciding what to ship.
Evaluate changes to your agents
Updating an investigation skill or upgrading the model can make the agent better at diagnosing some cases and worse at others, so we need to test their impact before updating them. We test two things separately: 1) how well the agent investigates and 2) how useful its summaries are to engineers.
Evaluating investigations
For investigations, we backtest against past production incidents. We turn those incidents into a suite of test cases we can rerun when we change the skill. A Codex agent attempts to investigate and resolve the incident, and we compare the agent’s behavior to the actual past resolution data. Each case starts with a fresh Codex investigator and the original signal, stripped of details that might give away the answer.
Historical tests need care. Metrics and traces expire, while evidence collected after recovery can give away the cause. A test is only useful if we understand what evidence the investigator could see. The agent can inspect code and query production telemetry within set limits. It cannot use saved memories (notes from earlier investigations), read the incident writeup, or see results from previous runs. We also inspect its transcript afterward for information that might have spoiled the test.
We score when the problem began, how large it was, and which requests were affected. We also evaluate how the agent uses evidence to rank possible causes and explain what remains uncertain. An agent can get the timing right and still blame the wrong deployment, so we score those separately.
Evaluating agent-to-engineer handoffs
We evaluate task summaries using snapshots of saved tasks. These make particularly good backtests because summarization does not depend on external metrics or traces that expire. A separate grader checks whether an engineer unfamiliar with the system can understand what happened and why it matters, whether useful charts were kept, and whether the proposed next step is supported by the evidence.
Turn recurring failures into self-repair
Lastly, our agents need monitoring just as much as the services they investigate. A broken profiler or a missing permission can keep an agent from verifying what caused a slowdown. Those failures can be hard to spot in the final report, so we run an agent every day to look through messages and logs from recent runs for tool failures and access errors.
We use the Performance Factory to self-repair and fix the problems this check uncovers. When the same tool error blocks several investigations, the agent creates a task to fix it. If the cause is clear, an agent proposes a fix, and an engineer reviews the change and decides whether to merge it. After merging changes like this, we also use evals to check whether agents can get past the step that previously blocked them.
What’s next: broader applications, proactive monitoring
The Regression Workflow is just one instance of the agent factory pattern that moves tasks through explicit states. Agents advance the task when more work is ready; separate reviewers challenge the conclusions; engineers step in when the next decision requires judgment. Other workflows can reuse the same machinery with different states, instructions, and events.
The original page includes a roughly 19-second video at this point, with the caption: “From one workflow to many. The Performance Factory can coordinate agents across workflows, with agents in one workflow creating tasks for another.” The in-page embed is on the original article; it was not separately archived here.
Currently, our Regression Workflow starts when an alert fires. However, we’re working on more proactive ways for the Performance Factory to find slowdowns and optimizations even when no alert fires. We want agents to use the large amount of fine-grained performance data we already collect to spot regressions our alerts miss or discover optimizations. By comparing different kinds of data (batches of CPU and memory profiles, heap dumps, and request traces across releases), an agent might notice a small increase in CPU for a given request. It can then open a task in the Regression Workflow to trace the increase to its cause, implement a fix, and open a PR for an engineer to review.
In cases where we already know what to look for, we’re working to encode known signals into more Performance Factory workflows. Our service rightsizing skill, for example, helps agents spot autoscaling settings that keep more replicas running than a service needs. When we learn to recognize a pattern like that, we want to build and regularly run a workflow for it across all our services, constantly optimizing in a rapidly changing environment. With the Performance Factory, what an engineer learns from one slowdown can shape how we investigate and fix the next one, even months later in a different service.
Next time you’re using ChatGPT and notice a slowdown, there’s a good chance the Performance Factory is already figuring out why. Today, the bottleneck may be waiting for an engineer to review and merge the fix. We’re already exploring whether agents can do this themselves. As product development keeps accelerating with Codex, performance systems need to become increasingly autonomous and self-improving to keep up. Codex already helps us build ChatGPT faster. Now it’s helping us keep ChatGPT fast.
Authors
Okay Zed, Cyrus Forbes
Acknowledgements
Special thanks to the team that built the Performance Factory, as well as our post contributors Brendan Gregg, Pieter Hooimeijer, Nick Cooper, and Louis Brandy.