Ethan Mollick / 文章
只算独立跑分,SatBench里做到85分的基准是24%,含实验室自报则是63%
沃顿的Ethan Mollick用Brian Zhou的Benchmark Almanac,把实验室发布会最常引用的基准当成一套大考。数据截至2026年11月14日。按默认口径,173项里有109项已经到了85分;只算独立跑分则是24%。
乔木改写
实验室自己报分时,SatBench里173项常被引用的基准有63%已经做到了85分。如果只算独立跑分,这个数字是24%。
沃顿的Ethan Mollick在2026年11月14日发布了SatBench。数据来自Brian Zhou做的Benchmark Almanac,同一天读取,并包含Epoch AI Benchmarking Hub(CC BY 4.0)的分数。Mollick在介绍帖里说,自己是把这套分析拼起来的,同时感谢Almanac。仓库里的分析、图表和代码以CC0发布,Almanac的底层数据并不随仓库分发,各来源仍保留自己的许可条款,Artificial Analysis的分数也因为条款原因没有纳入。
他把实验室发布会里被点到至少10次、而且按百分制越高越好的基准,当成一套大考的题目。每个版本单独算一项,所以AIME 2024和AIME 2025是两题。一项基准被记为做完,是因为有人报出的最好成绩到了85%。这个分数可以来自官方榜、Epoch AI,也可以来自实验室自己的发布会。这和Almanac网站自己的frontier以及85%门槛一致。
SatBench的分数,就是这些题目里被做完的比例。SatBench-live会在一项基准发布时把它加进去,问的是现在已经有的基准被做完了多少。SatBench-2023、SatBench-2024和SatBench-2025则把题目冻结在当年年底,像一套不再加题的试卷。谁先把一项基准带到85分,记为一次kill。还有9项是生下来就被做完的,比如新一年的AIME和HMMT,因为在基准出现之前,已有模型的分数已经过了85%。
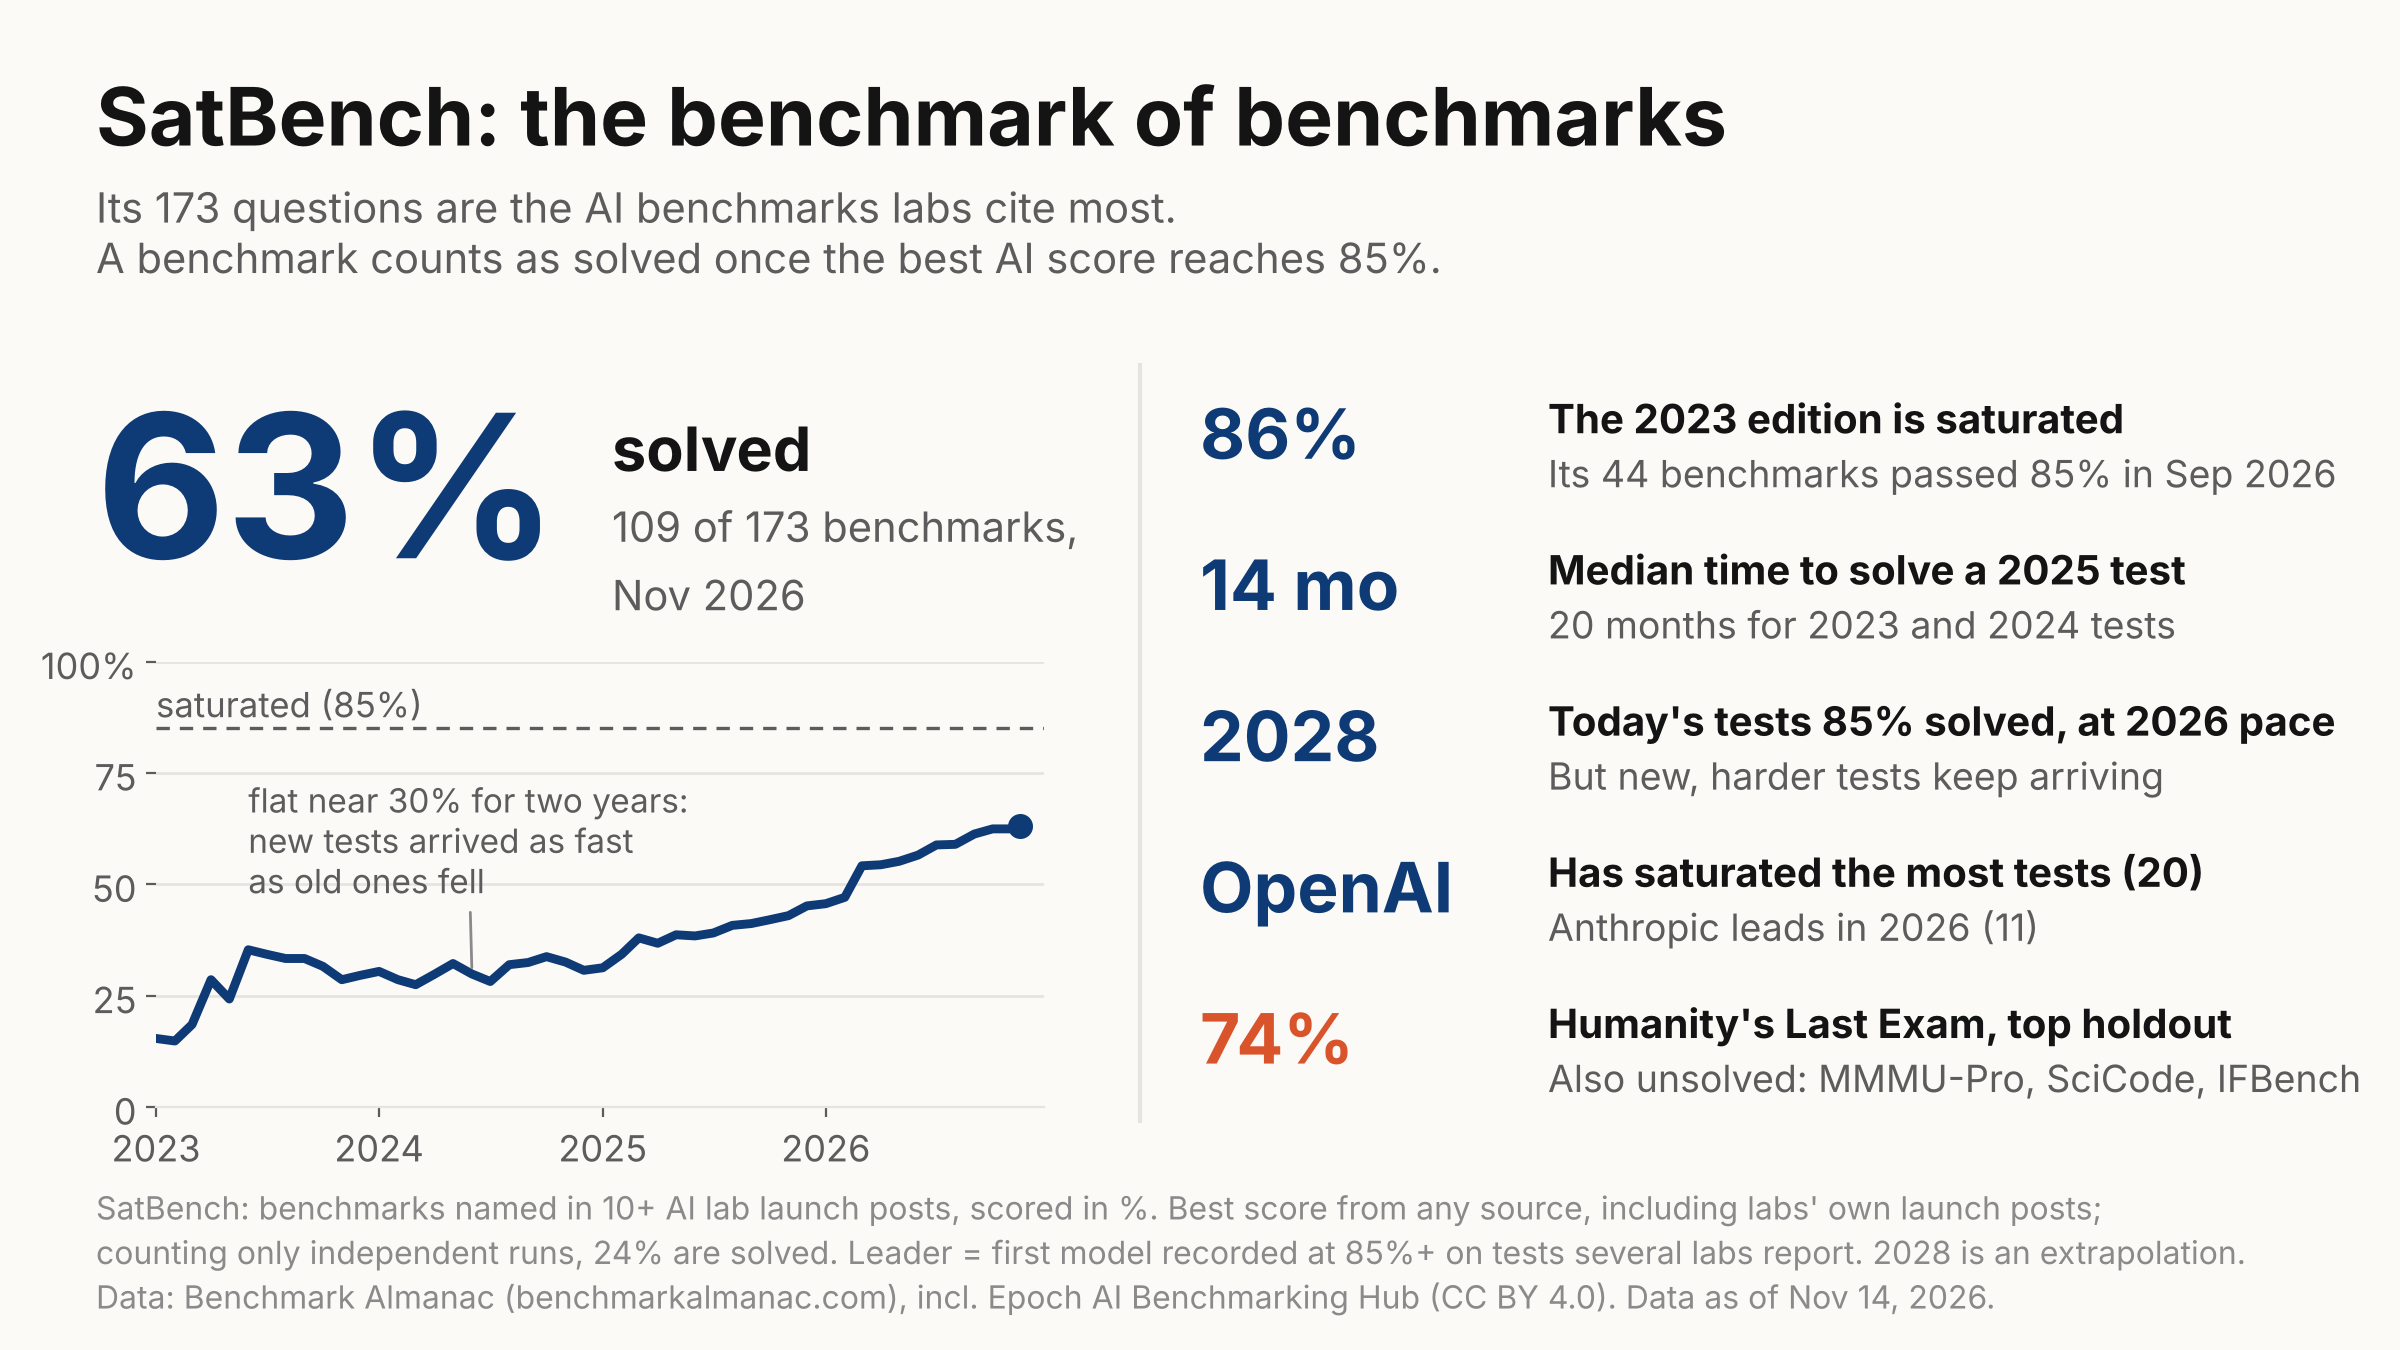
按默认口径,SatBench现在是109/173,也就是63%。它在2023年到2025年初一直在30%附近徘徊,2024年1月是30%,2025年1月是31%,新基准进来的速度差不多赶上旧基准被做完的速度。随后开始往上走:2026年1月是46%,3月超过50%,现在到了63%,12个月里升了20个百分点。
这套基准的基准,自己的第一版已经饱和。SatBench-2023有44项,现在是86%,在2026年9月跨过85%。SatBench-2024是78%,SatBench-2025是69%。这三套在各自冻结当天分别是32%、34%和47%。总结卡把这几个数字和OpenAI、Anthropic的名次放在一起,并标出Humanity’s Last Exam当时最高分是74%。
媒体未能载入,请通过下方原文链接查看。
上升这件事不取决于怎么定义,但绝对水平会变。今天的水平,按不同口径,可以是24%,也可以是82%。各种口径在2024年底之前都比较平,真正往上爬是在2025到2026年。
| 口径 | 今天的水平 |
|---|---|
| 做到75%就算做完 | 82% |
| 做到85%(默认) | 63% |
| 做到95% | 25% |
| 只算独立跑分(不含实验室自报) | 24% |
| 只算发布会里被点到3次以上的项目 | 47% |
| 只算被点到20次以上的项目 | 72% |
实验室还在换新题,所以他们眼下还在报的那一批,大约一半没做完。所谓工作集,是过去6个月里被至少2篇发布会点到的基准,这个定义不靠事后看。2024年它的做完比例在47%到60%之间,2025年年中以后停在41%到47%,今天是45%,也就是106/236。存量基准正在被用完,但实验室换上更难的新题,速度差不多跟得上。
发布会里已经过了85%的旧题,占比也在下降。一篇发布会点到的基准里,发文前就已经过线的比例,全部实验室是2025年48%、2026年39%。前沿实验室在2026年年中以前大约32%到42%,2026年第四季度目前是22%。2026年里,OpenAI最低,是24%,Anthropic是30%,Google是41%,一些更小的实验室超过50%。不过GPQA Diamond在2026年仍出现在102篇发布会里,而且每一篇都是在它过了85%之后。
新基准被做完的速度在加快
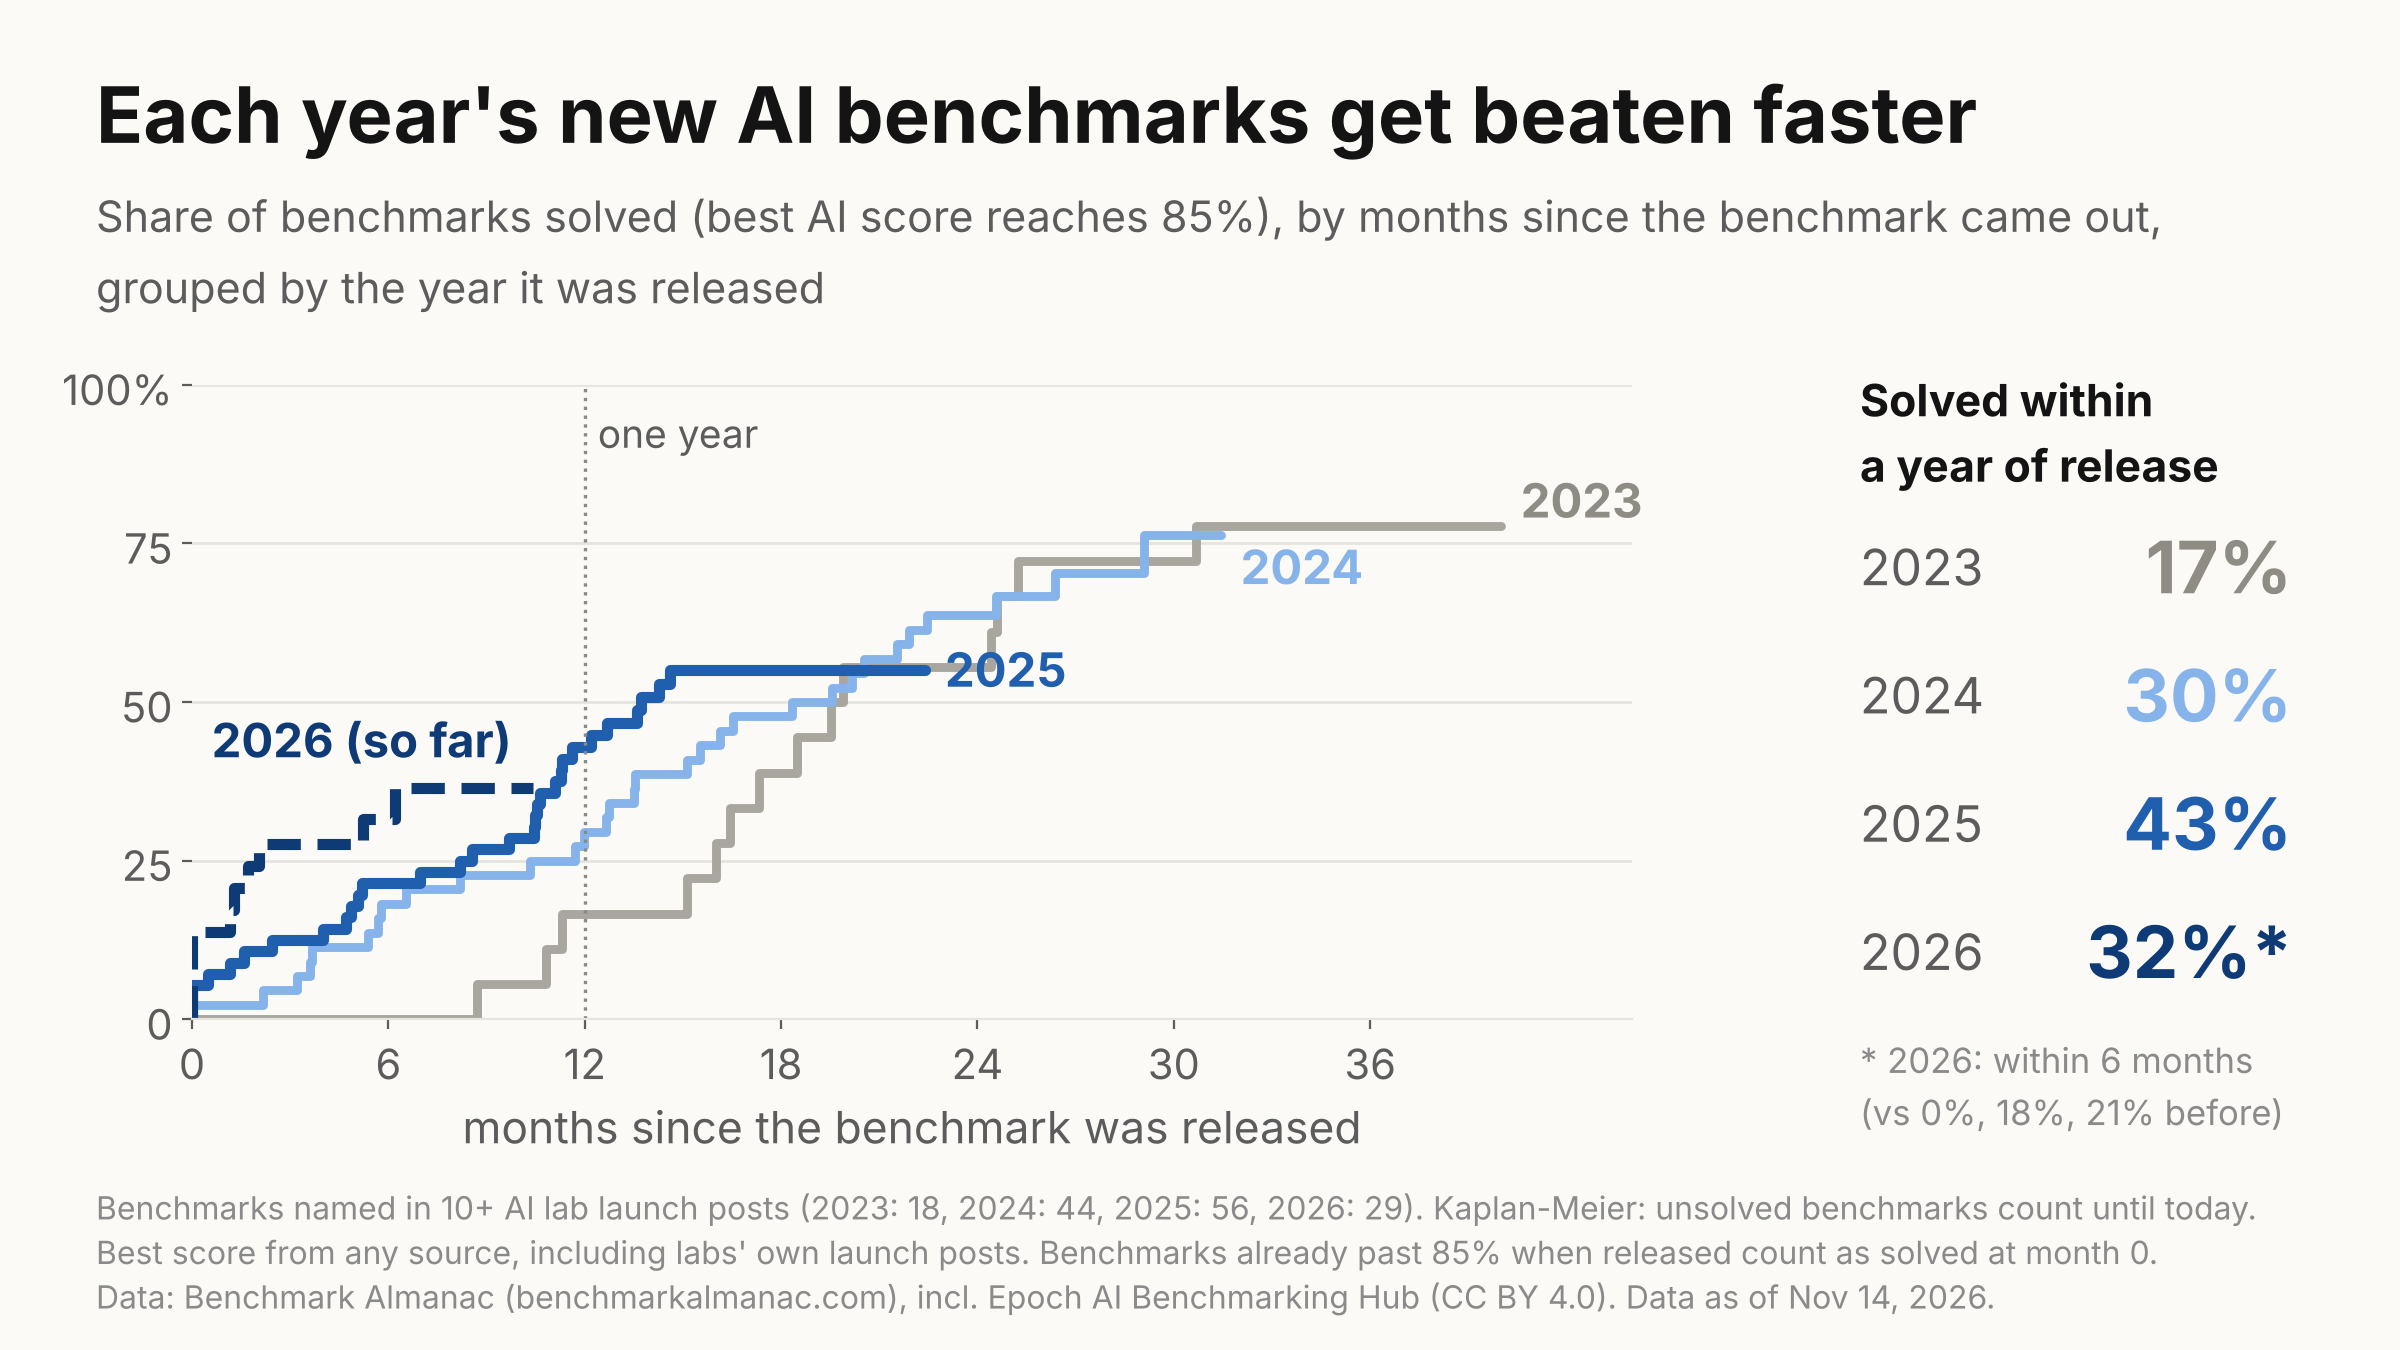
新基准被做完的速度也更快。按Kaplan-Meier估计,从发布到85%的中位时间,2023年和2024年的基准是19.5个月,2025年的是13.7个月,不过2025年这一档置信区间的上限还没闭合。2026年的还没走到中位时间。
发布后12个月内被做完的比例,2023、2024、2025三届分别是17%、30%和43%。已经过95%的有43项,从85%再到95%的中位时间是6.5个月。过了85%的项目里,大多数还没到95%。
配图按发布年份画出各届基准被做完的曲线。2026年这一届在图上标的是发布后6个月内做完32%,脚注写,前几年同期分别是0%、18%和21%。图中还注明,2023年进入统计的基准是18项,2024年44项,2025年56项,2026年29项。
媒体未能载入,请通过下方原文链接查看。
按领域看,推理做完了80%,知识79%,多模态66%,代码55%,智能体45%,工作类18%。智能体和工作类占了最新测试的大多数。智能体测试只要满一年,被做完的速度就不比别的领域慢。
谁先做到85分,要看怎么数
如果按原始kill、不含生下来就做完的项目:OpenAI 24次,Google 19次,Qwen 17次,Anthropic 14次,ByteDance Seed 6次,Meta 4次。Z.ai、Mistral、NVIDIA和Liquid AI一次都没有,尽管各自至少发过10篇发布会。
Mollick写,原始kill会误导,Qwen是最清楚的例子。kill记录的是第一个被记下来越过85%的分数。如果前沿实验室根本没跑过这项基准,谁先报了,谁就算。Qwen的发布会列出的基准远比别人多,173项里占了137项。Qwen拿下的那些基准,被点名次数的中位值里,有65%来自Qwen自己;OpenAI、Google和Anthropic这一比例是7%到14%。比如MAXIFE的11次点名全是Qwen,SLAKE的10次全是Qwen,MLVU的21次里有17次是Qwen。前一个最好成绩,通常也是Qwen自己更早的模型。其中5次kill来自2026年2月同一篇Qwen3.5发布会,而且都是自报。
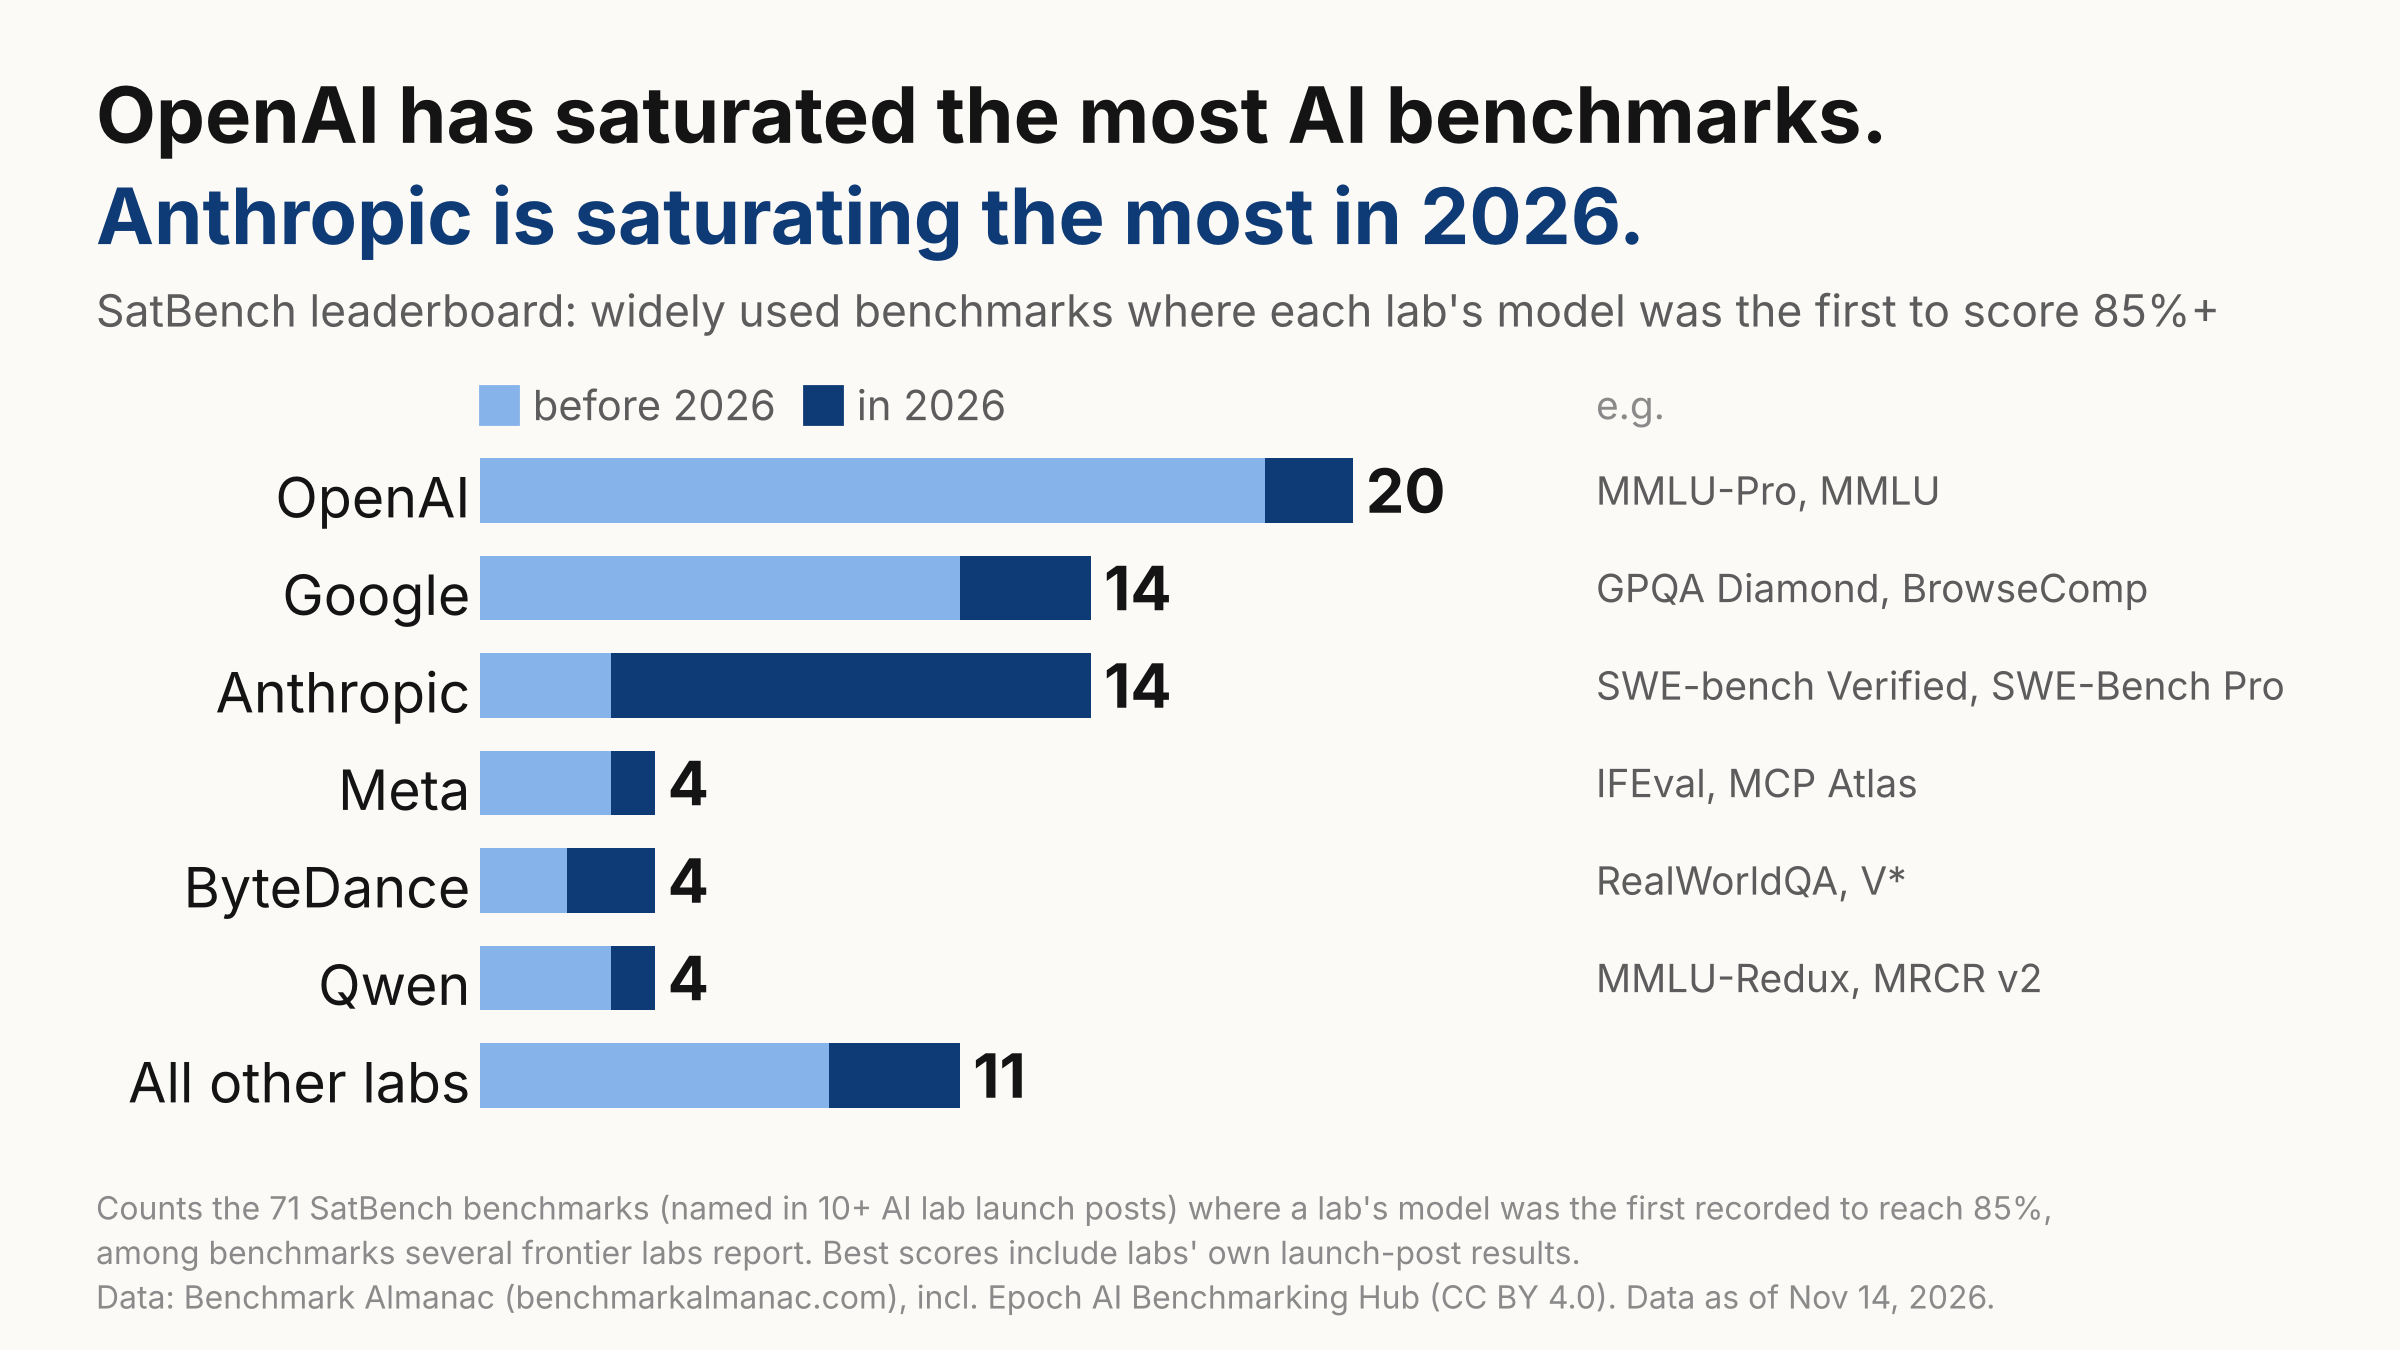
他更看重有竞争的kill:只统计其他前沿实验室也在报、并且在那些实验室至少5篇发布会里出现过的基准。这样算下来,OpenAI 20次,Google 14次,Anthropic 14次,然后是Qwen、ByteDance和Meta,各4次。100次kill里有71次符合这个口径。如果把门槛放到至少3次,Qwen是7次;放到至少10次,Qwen是0次。前三名在各道门槛上都不变。
2026年,有竞争的kill里Anthropic占了11次,Google 3次,OpenAI 2次。Qwen在2026年唯一一次有竞争的kill是MRCR v2,自报90.4,对照Gemini 3.1 Pro的84.9,而且MRCR v2有多种上下文长度版本,这两个数字不一定能直接比。
再按报告量调整,排序又会变。每10篇发布会,Anthropic 5.8次,OpenAI 4.7次,ByteDance 4.0次,Qwen 3.8次,Google 3.3次。按该实验室曾经点过的每100项SatBench题目算,OpenAI 34,Anthropic 25,Google 22,Qwen 12。
100次首次过线里,有75次来自实验室自己的发布会,2026年这一比例是81%。这75次里,后来只有10次被独立跑分做到85%或以上。这有一部分是结构决定的:发布当天的自报,几乎总是早于外部评测。
排行图用的就是有竞争的口径,只数这71项被多家前沿实验室同时报告的基准。图上OpenAI累计20次,举例是MMLU-Pro和MMLU;Google 14次,举例是GPQA Diamond和BrowseComp;Anthropic 14次,举例是SWE-bench Verified和SWE-Bench Pro;Meta、ByteDance和Qwen各4次,其余实验室合计11次。深色段表示2026年拿到的次数。
媒体未能载入,请通过下方原文链接查看。
还没做完的64项,并不都是因为难
还没做完的有64项。被点名最多的包括:Humanity’s Last Exam最高是74.2,这是带工具的实验室自报,网站上独立榜最好成绩是54.8;还有MMMU-Pro的84.6、IFBench的82.9、Terminal-Bench 2.0的84.7、DeepSWE的79.0、AutomationBench的76.1,以及SciCode的59.8。
这64项里有13项已经在82分或以上。有4项离85分不到0.5分:LiveBench、TextVQA、Terminal-Bench 2.0和MMMU-Pro。被点名最多的那14项里,过去12个月分数的中位提升是12.6分,大多数仍在动。
有些留着,未必是因为难。有21项已经至少6个月没有新的最好成绩,其中14项正在淡出,或者已经从发布会里消失,例子是LiveCodeBench v5和最初的tau-bench。HealthBench从2025年8月起停在67.2,仍有人用,但没有再往上走。
有些基准的天花板可能本来就低于100%。FutureHouse的一项审核,对Humanity’s Last Exam里大约29%的化学和生物学答案提出异议。Prime Intellect发现AutomationBench的评分器有缺陷。Epoch把FrontierMath的天花板放在57,目前最好成绩是52.4。
按最近一年的速度外推,不是预测
过去12个月里,一项尚未做完的基准,每个月大约有**5%**的机会被做完,计算依据是858个项目月里出现了43次过线,10%到90%的范围是4.1%到6.0%。
如果只看今天这固定的173项,按这个速度,SatBench自己做到85%大约会在2028年5月,80%的范围是2028年1月到11月。如果改用过去6个月、24个月或2025年的速率,结果会落到2028年8月到10月。
SatBench-live往上爬会慢得多,因为还没有做完的新题会不断进来。这里假设新题仍按2025年的速度,每月增加4.7项,其中9%生下来就被做完。按这个算法,它到2028年底大约是73%,要到大约2033年才会到85%,范围是2031年到2036年。Mollick把它写成一台跑步机。
这条模型最大的弱点是:它假定剩下的题不会比已经做完的更难,新题也不会被特意做成抗饱和。
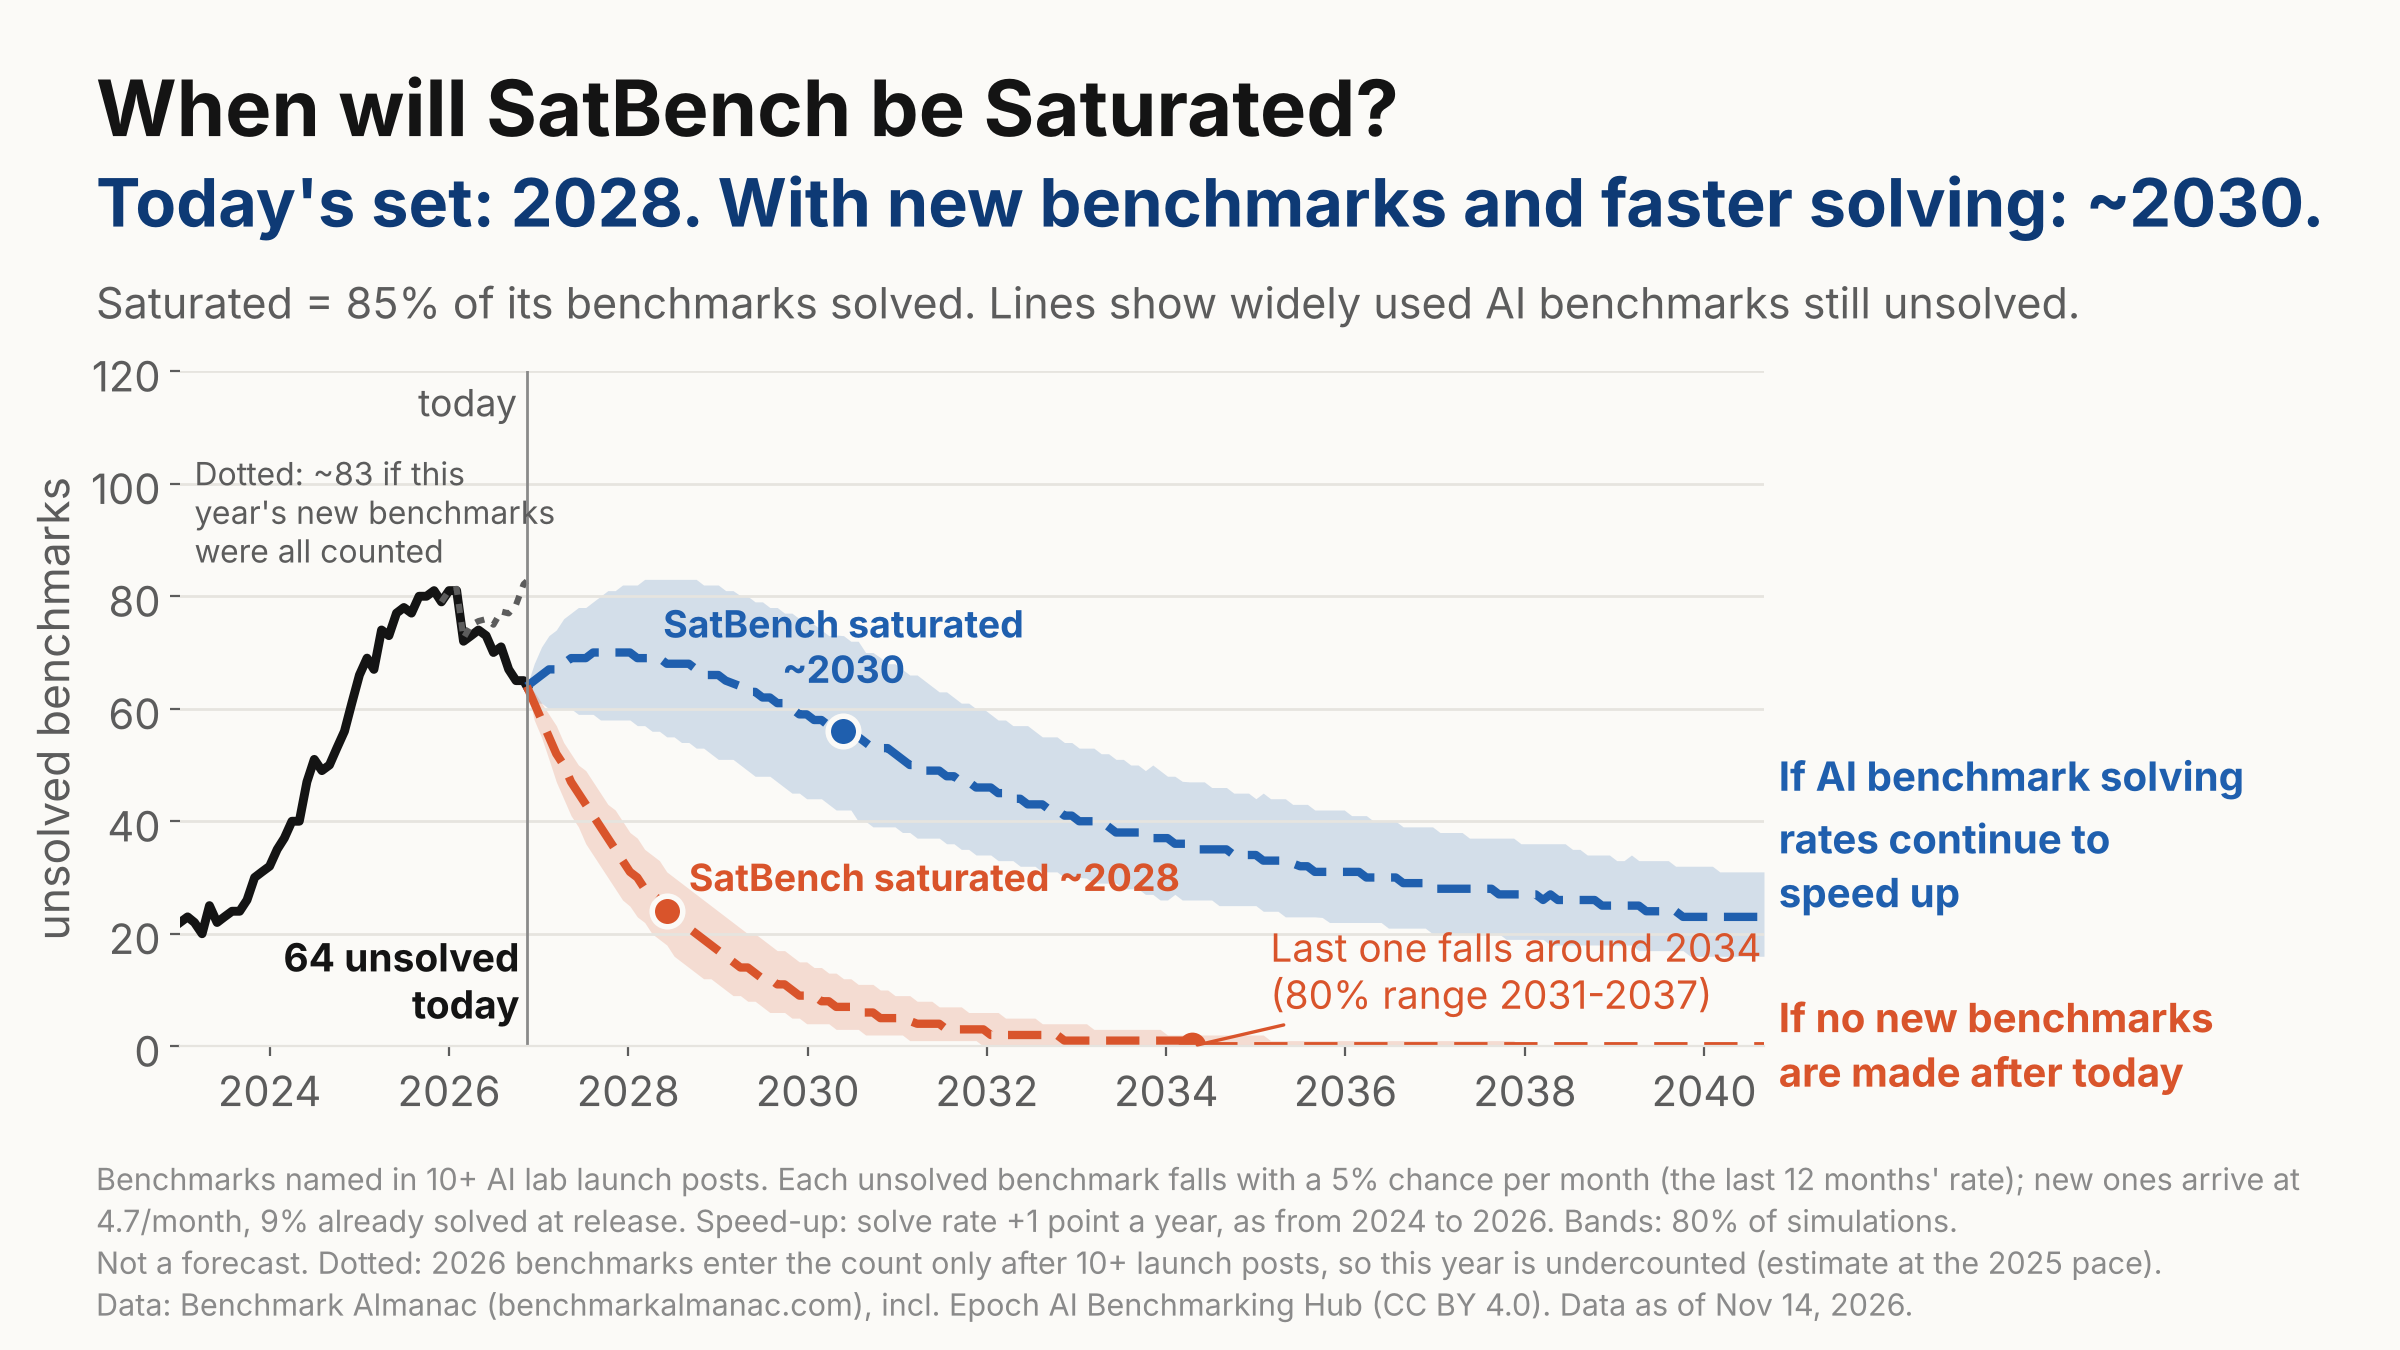
他还模拟了什么时候会把基准用光。今天还剩64项没做完。如果从此不再有人出新基准,最后一项大约会在2034年被做完,80%的范围是2031年到2037年。95%被做完会比这更早。如果新基准仍按2025年每月4.7项的速度进来,而且解题速度继续加快,每年提高1个百分点,就像2024年到2026年那样,那么到2034年还没做完的大约会降到34项,仍然不会到零。如果没有这一加速,未完成的数量会在大约85项附近稳住,大致等于每月新题数量除以做完速率。分享图没有画出这条没有加速的路径。
SatBench本身做到85%的时间,固定题集大约是2028年年中;如果新题继续进来、解题继续加快,大约是2030年年中,80%的范围是2029年年中到2031年年中。分享图的标题是When will SatBench be Saturated?,主标题写成:今天这批大约是2028年,加上新基准和更快的解题大约是2030年。
媒体未能载入,请通过下方原文链接查看。
未完成数量为什么先升后降,他也写了原因。2023年到2025年是上升的:2023年新进18项、做完10项,2024年新进44项、做完16项,2025年新进56项、做完38项。2026年看起来在下降:做完了41项,但新计入的只有29项。这个缺口大多来自统计滞后。一项基准要先攒够10次发布会点名才进SatBench,2025年的基准做到这一点的中位时间大约是9个月,所以2026年的新题大多还没被算进去。如果按2025年的进入速度调整,今天未完成的数量大约会是83项,大致持平,而不是64项。图上用点线标出了这一档。
所以,只有在人们不再出新基准时,这些题才会被用光。真正的约束是新测试能不能继续保持难度。发布时就已经被做完的新基准占比也在上升:2023年是0%,2024年是2%,2025年是7%,2026年是14%。
2023年那套常考题,在前沿发布会里几乎消失了
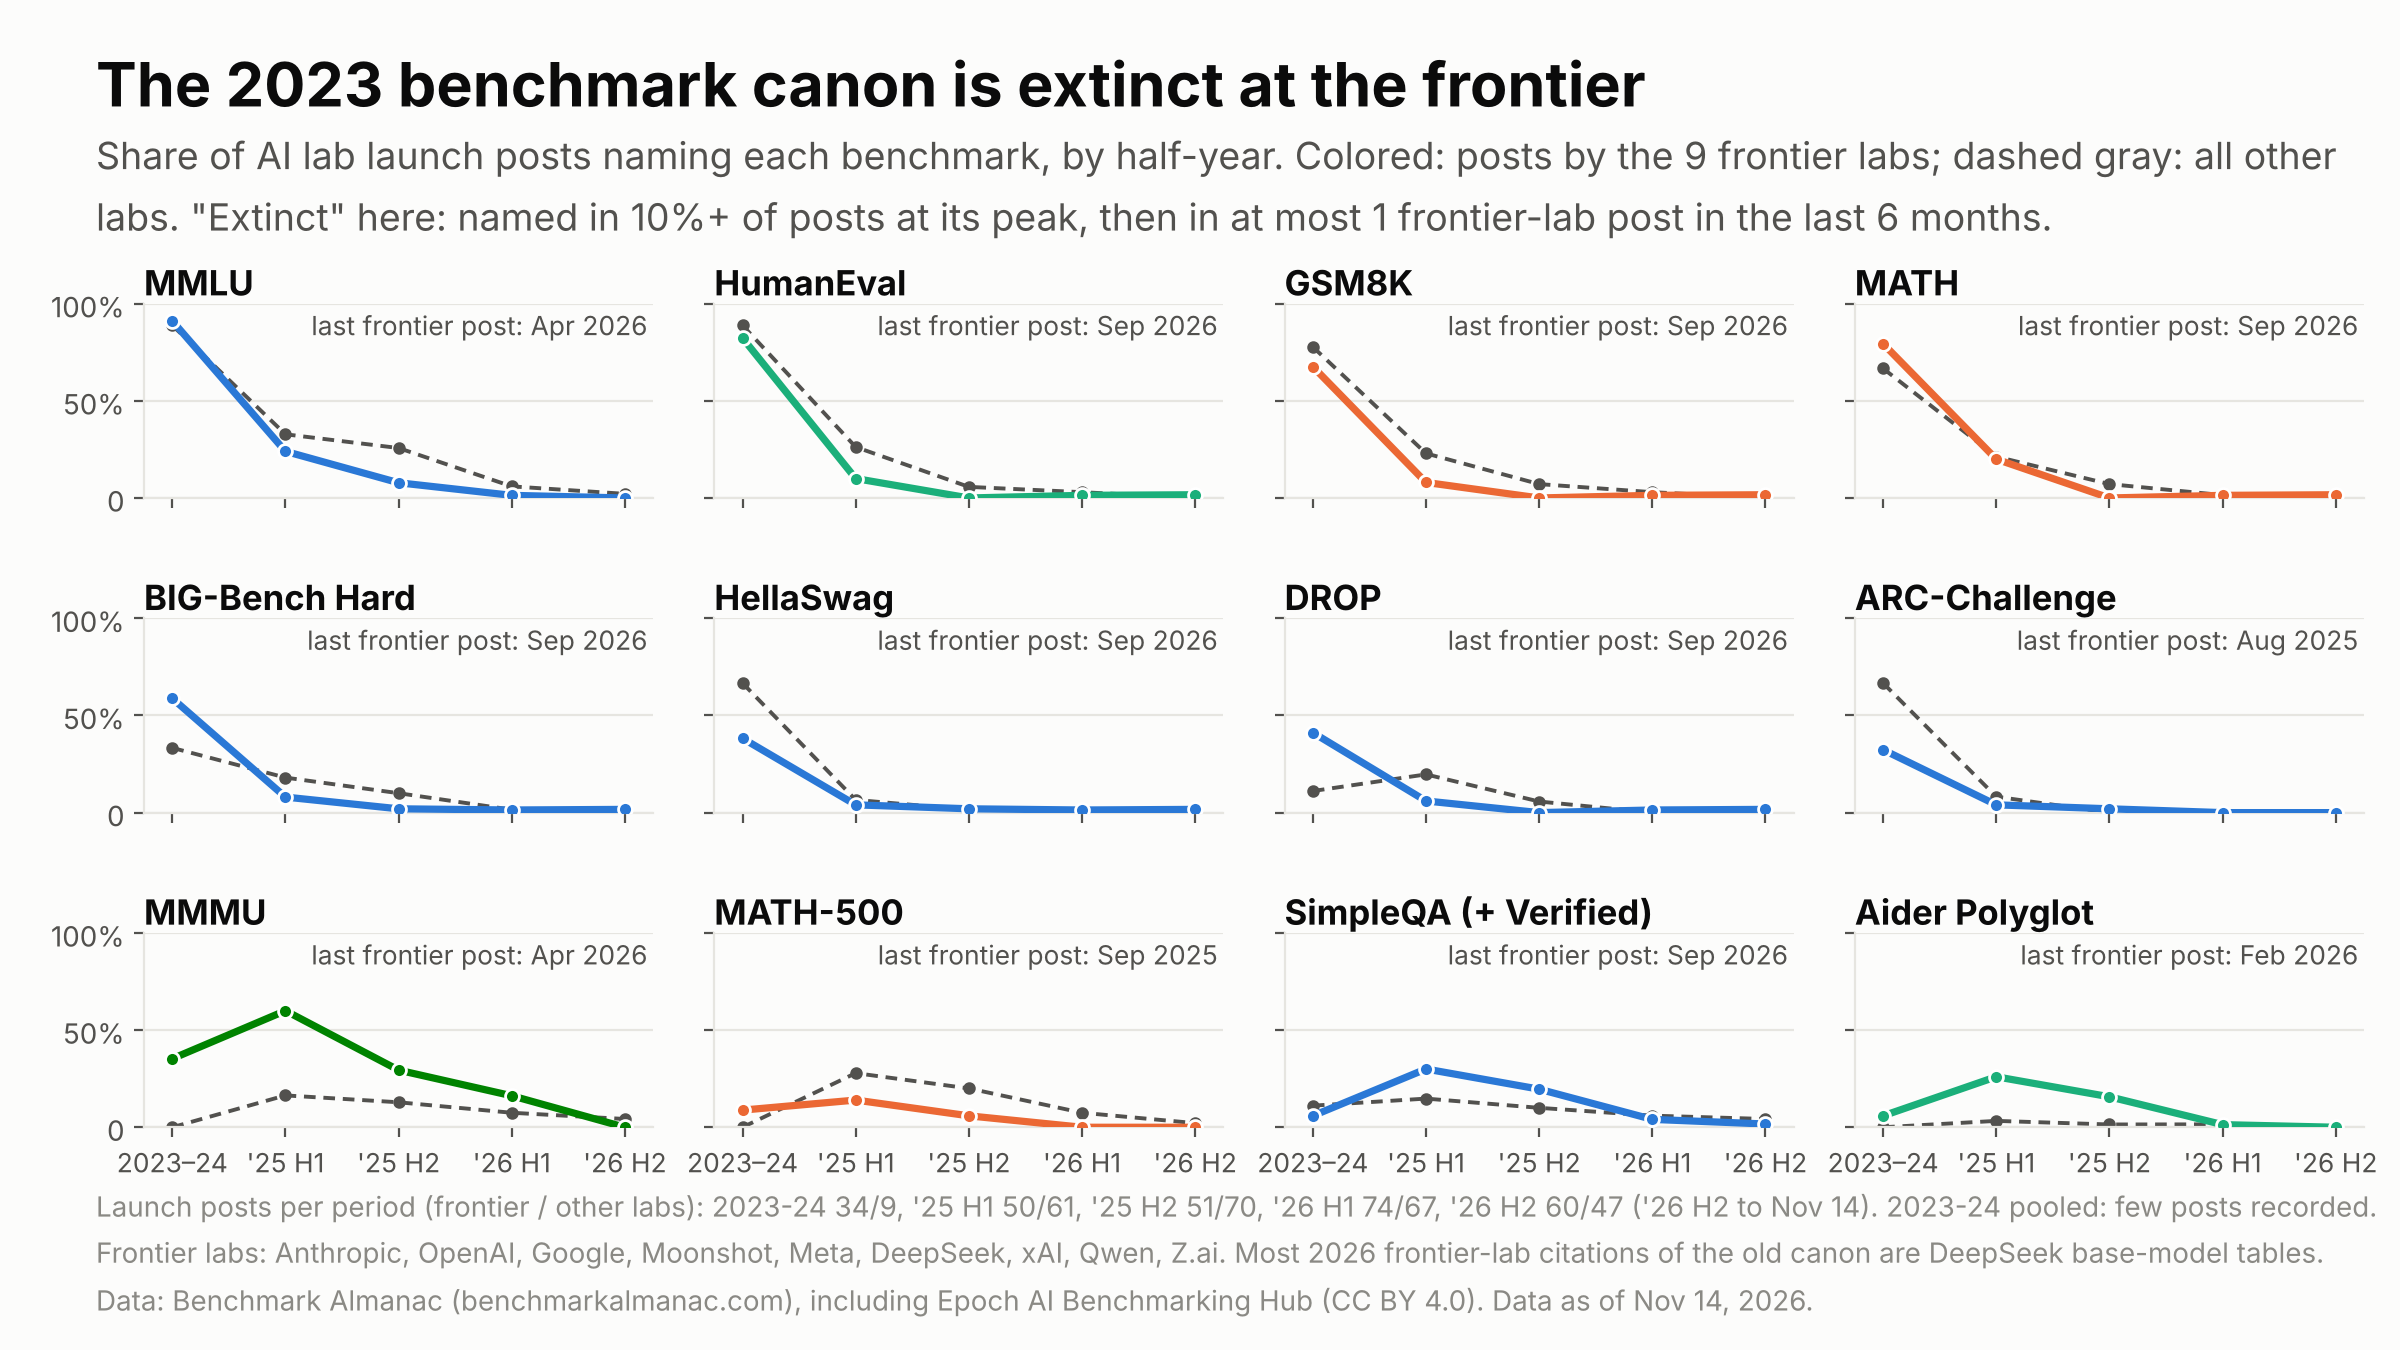
同一仓库里还有一组关于相关性和退场的分析。所谓退场,指一个基准家族(不同年份版本合并计算,所以AIME 2024换成AIME 2025不算退场)曾经在全部发布会和前沿实验室发布会里都达到至少10%的点名率,但在最近6个月里,前沿实验室最多只再点过一次。这里的前沿实验室是Anthropic、OpenAI、Google、Moonshot、Meta、DeepSeek、xAI、Qwen和Z.ai。
发布会里最常被点到的30项基准中,有24项已经过了85%,12项过了95%。仍低于85%的有Humanity’s Last Exam(74%)、MMMU-Pro、Terminal-Bench 2.0、IFBench、AutomationBench和DeepSWE。ARC-AGI-2从2025年4月的6.5%,到了2026年9月的95%。
2023年那套常考题,在前沿发布会里已经近乎消失。这套题是MMLU、HumanEval、GSM8K、MATH、BBH、HellaSwag、DROP和MGSM。2023年到2024年的34篇前沿实验室发布会,每一篇都至少点过其中一项。2026年的134篇里只有2篇还在点,而且都是DeepSeek的基座模型表。32个符合退场定义的家族里,有28个在前沿实验室最后一次点名时已经过了85%。基准往往是先被做完,然后才被放下。
接下来可能离开发布会的,还包括SWE-bench Verified,它在前沿实验室发布会里的占比从57%降到1.7%;AIME这一家族从65%降到1.7%;MMLU-Pro从34%降到1.7%。2026年,MMLU在134篇前沿实验室发布会里只出现1次,在114篇其他实验室发布会里出现5次。
退场图按半年画出这些老题被点名的比例,彩色线是9家前沿实验室,灰色虚线是其他实验室,并标出了各题在前沿发布会里最后一次出现的时间。图里除了上面那套2023年常考题,也画了ARC-Challenge、MMMU、MATH-500、SimpleQA(含Verified)和Aider Polyglot。脚注写,2023年到2024年的样本较少,2026年对这套旧题的点名,大多来自DeepSeek的基座模型表。
媒体未能载入,请通过下方原文链接查看。
大多数基准其实在量同一件事
相关性分析看的是43项常用能力基准,每个家族只留一个版本,不含安全测试。一对基准至少要有15个模型同时有成绩才纳入,903对里有767对达到这个门槛,重叠数的中位数是35个模型。
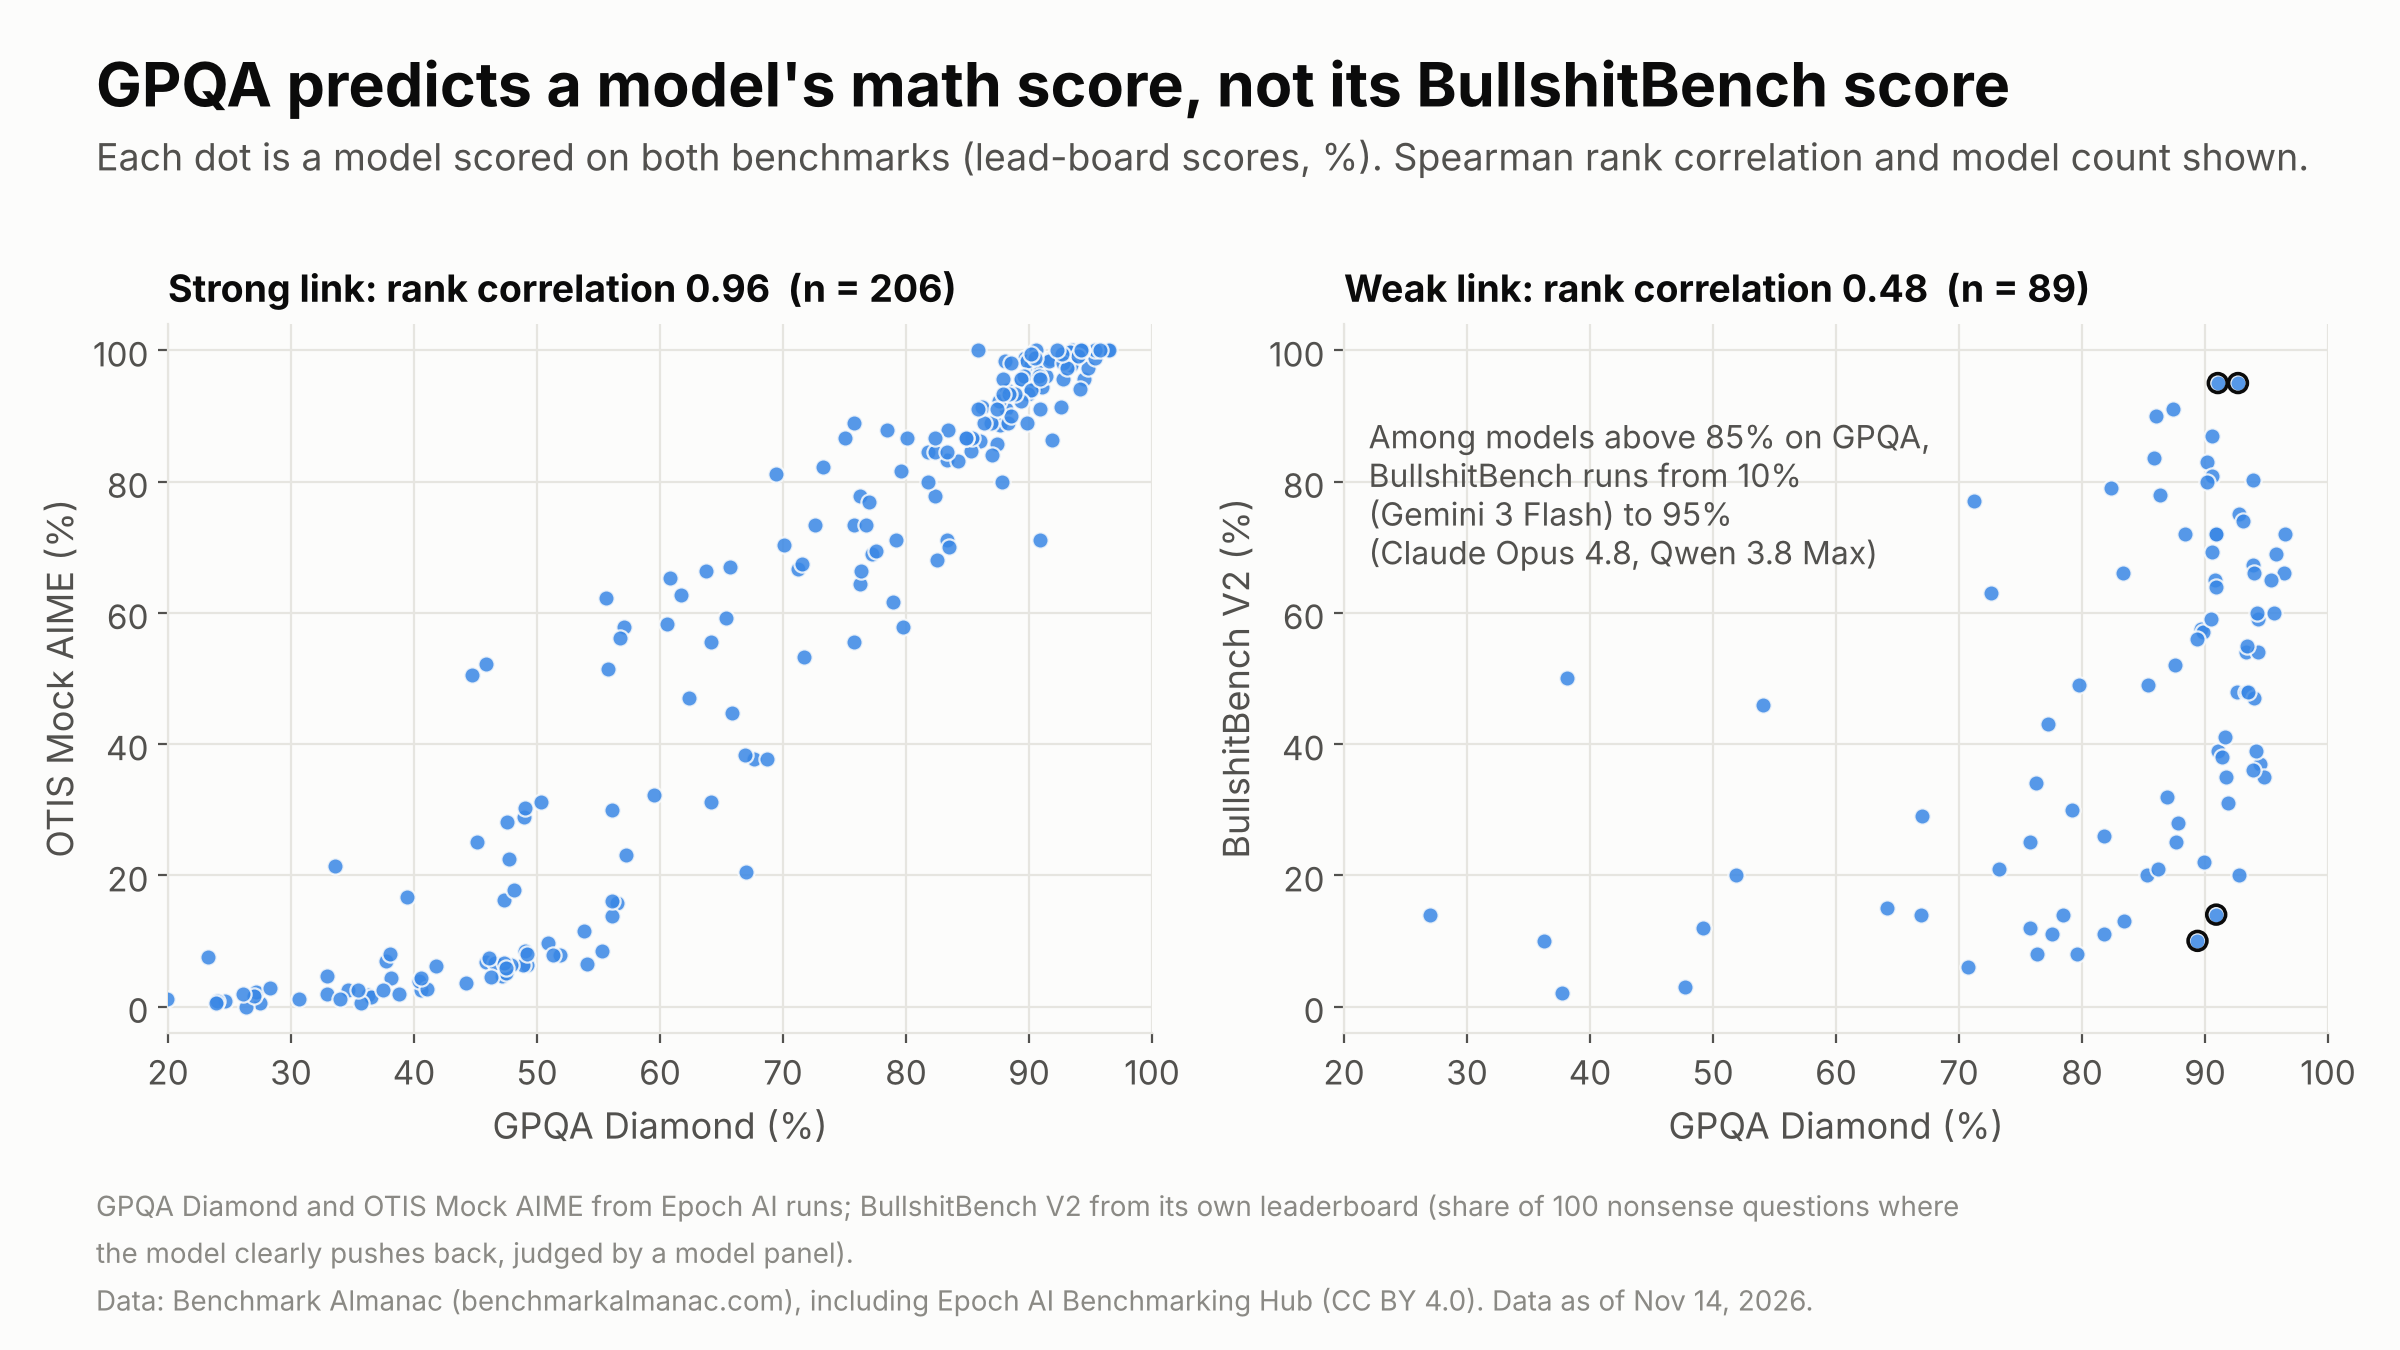
几乎所有基准都彼此相关。Spearman相关系数的中位数是0.67,76%的对比超过0.5,只有13对是负相关。GPQA Diamond和OTIS Mock AIME在206个模型上的相关是0.96。
这些相关,大部分来自同一个通用能力因子。用来控制的是Epoch Capabilities Index。控制之后,中位数降到0.06,724对里只剩36对还高于0.5。如果改成用发布日期来控制,中位数仍有0.52。同一领域内的对比平均是0.64,跨领域是0.62,领域标签几乎不起作用。
去掉通用能力之后仍绑在一起的,包括LMArena文本和Vision Arena,相关0.90,它们来自同一平台;SimpleQA Verified和SimpleBench是0.79,和GPQA是0.74,看起来像是一项会不会记事实的因素;OTIS和MATH Level 5是0.67;两项国际象棋基准是0.54;LegalBench和MedCode是0.54,它们由同一评测方出具。相对更独立的是Vectara幻觉率、SnakeBench、GAIA和BullshitBench V2,它们与Epoch Capabilities Index的相关分别是0.33、0.53、0.55和0.62。
散点图左边是GPQA Diamond和OTIS Mock AIME,相关0.96,样本206个模型;右边是GPQA Diamond和BullshitBench V2,相关0.48,样本89个模型。在GPQA上已经超过85%的模型里,BullshitBench的分数可以从大约10%(图上标的是Gemini 3 Flash)一直拉到大约95%(图上标的是Claude Opus 4.8和Qwen 3.8 Max)。分析正文里也写,这些在GPQA上过了85%的模型,BullshitBench可以从10%到95%。
媒体未能载入,请通过下方原文链接查看。
聚类是软的。去掉这个通用因子之后,主要分野是做产品和智能体任务的基准,对着考试类基准。Almanac自己的学科分区,和基准实际聚在一起的方式几乎对不上,竞赛编程的表现更接近数学。第一主成分占了信号的82%,并且和发布日期相关,Spearman是0.81。它单独就能预测61%的留出分数,全部10个成分是68%。第二主成分占5.6%,一边是DesignArena、SWE-bench Verified、APEX-SWE这类搭建和智能体榜,另一边是AIME、SMT、BRUMO、MMLU-Pro这类考试。轮廓系数只有0.04到0.06,学科分区和聚类的调整兰德指数只有0.14,只有47%的基准离自己所属领域最近。
这些数字撑不住什么
许多被记为做完的基准,其实只建立在实验室自己的成绩上。最好分数混杂了不同的评测架、工具使用、best-of-n和发布会上的自报。只算独立跑分,SatBench是24%,不是63%。有44项完全没有独立跑分。在有独立跑分的129项里,只算独立成绩是33%,把所有来源算进去则是60%。
过去一年的上升,有一部分来自新基准还没被算进来。一项基准要先攒够10次发布会点名,2025年的基准做到这一点的中位时间是8.7个月,所以2026年的新题大多还没计入,而它们多半还没被做完。如果大约再计入20项尚未做完的2026年基准,实时分数大约会是57%,不是63%。要看速度,最干净的是固定的2025年版:它在2026年里从47%走到了69%。
2023年和2024年的数字比较粗。那两年总共只有43篇发布会,而此后大约每年有230篇。有些过线被记在基准出现之前,也就是那9项生下来就被做完的题目,因为分数是按模型发布日期记的,不是按实际考试日期。指数给每项基准同样的权重,如果按点名次数加权,水平会更高,被点到20次以上的项目是72%。
Mollick还单列了一批值得核对这些Almanac数据的地方,写成可能的错误,不是已经确认的结论。有些过线日期早于基准发布,例如AIME 2026被记在Qwen3-30B-A3B-Thinking名下,时间是2025年7月,分数88.3,他还写,一个30B模型拿第一显得可疑;类似的还有HMMT Nov 2025(grok-4)、HMMT 2026(Gemini 3 Pro)、tau3-bench(Claude Opus 4.5)、PinchBench(Gemini 3 Flash)和RULER(Command R)。OSWorld 2.0的公开榜最高是20.6,实验室发布会却报到62.6到77.9,他估计可能是不同变体或不同评测架。同一模型上,实验室自报远高于独立跑分的例子包括:Chartography里Claude Opus 5.5自报89.0,独立跑分是66.3;GDP-PDF里Claude Fable 5.1自报85.4,独立跑分是49.4。SimpleQA的kill记在Perplexity Sonar Pro(85.8),它是带着网页搜索答题,不是闭卷。字段也不完全整齐:onemillion-bench的best是42.1,和它frontier末尾的68.8对不上;PMC-VQA被归在工作类,LiveBench被归在其他;还有两个kill模型在models.json里没有实验室,分别是palm-2-l和minicpm-v-2-6。
相关性分析也写了自己的限制:Epoch Capabilities Index有一部分就是用这43项里的14项建出来的,这会让它们看起来更贴这个指数;大约30个共同模型时,控制后的相关大约有正负0.2的不确定性;各榜的评测架不同,有些分数还来自实验室自报。2023年到2024年的退场结论同样建立在只有43篇发布会上,而且2023年以前的组别有存活者偏差,会把早期显得更慢这件事夸大。2023、2024、2025这三组之间比较,要公平得多。
想核对实验室发布会上的分数,可以把自报和独立跑分分开看。63%和24%差的就是这件事。若要看实验室眼下还在用的题,工作集今天是45%,不是存量大考的63%。外推到2028年或2030年,作者写明这不是预测,前提是剩下的题不会比已经做完的更难,新题也不会被特意做成抗饱和。
原文
SatBench: a benchmark of AI benchmarks
媒体未能载入,请通过下方原文链接查看。
媒体未能载入,请通过下方原文链接查看。
媒体未能载入,请通过下方原文链接查看。
媒体未能载入,请通过下方原文链接查看。
媒体未能载入,请通过下方原文链接查看。
媒体未能载入,请通过下方原文链接查看。
SatBench: a benchmark of AI benchmarks
Ethan Mollick posted on X on 14 November 2026:
AI is getting better faster than our measurements are
I threw together SatBench, which measures how quickly major AI benchmarks become saturated (effectively beaten). Of 173 benchmarks cited by the Labs since 2023, 63% are now saturated. Saturation is happening faster each year.
In a follow-up, he linked the repository and thanked the Benchmark Almanac:
Here: https://github.com/emollick/satbench
Also thanks to The Benchmark Almanac: https://github.com/brianlzhou/benchmark-almanac
The complete write-up below is from the SatBench repository at commit 1ccb73eb36fe5204c6fbbf1e154f258c3de99bfe (CC0). Data come from the Benchmark Almanac by Brian Zhou (https://benchmarkalmanac.com, https://github.com/brianlzhou/benchmark-almanac), including Epoch AI's Benchmarking Hub (CC BY 4.0). Data as of 14 November 2026.
SatBench: a benchmark of AI benchmarks
Two analyses of how AI benchmarks get used up, built on the Benchmark Almanac (GitHub) by Brian Zhou. Data as of Nov 14, 2026.
- SatBench treats the 173 benchmarks AI labs cite most as the questions on one big exam. A question is solved once the best reported AI score reaches 85%. How much of the exam is solved, how fast, by whom, and when does it run out?
- Benchmark analysis looks at how benchmarks relate to each other (correlations and clusters) and at which ones labs have stopped reporting.
Every number comes from the almanac's own TypeScript data layer, so it matches the site. Each folder has a
summary.md with the full findings and caveats, and a scripts/ folder that rebuilds every chart.
SatBench
SatBench stands at 63%: 109 of its 173 benchmarks are solved. It sat near 30% from 2023 to early 2025, while new benchmarks arrived about as fast as old ones fell, then climbed 20 points in the last 12 months. Its own first edition, the 44 benchmarks that existed by the end of 2023, crossed 85% in September 2026, so the benchmark of benchmarks has saturated once already.
New benchmarks fall faster each year. The share solved within a year of release went from 17% for 2023 releases to 30% for 2024 and 43% for 2025. The median time to 85% fell from about 20 months to about 14.
OpenAI has been first past 85% on the most benchmarks (20), and Anthropic leads in 2026 (11). A lab gets credit when its model is the first recorded at 85% or above. Raw counts reward labs that report many niche benchmarks no one else runs, so this leaderboard counts only the 71 benchmarks that several frontier labs report.
When will SatBench be saturated? At the last 12 months' pace, about 5% of unsolved benchmarks fall each month. Today's fixed set would be 85% solved around 2028. With new benchmarks arriving at the 2025 pace and solving continuing to speed up, the live index gets there around 2030. We only run out of benchmarks if people stop making them. This is an extrapolation, not a forecast.
More charts: satbench/index/ (the index, its robustness to other definitions, and
projections), satbench/items/ (holdouts and areas), and satbench/labs/
(who solved what, and how many already-saturated benchmarks labs still headline). Full write-up:
satbench/summary.md.
Benchmark analysis: correlations, extinction, clusters
- The 2023 canon is extinct at the frontier. Every frontier-lab launch post from 2023-24 named at least one of MMLU, HumanEval, GSM8K, MATH, BBH, HellaSwag, DROP or MGSM. In 2026, 2 of 134 did. Benchmarks are saturated first and dropped second: 28 of the 32 extinct families were past 85% when labs last named them.
- 24 of the 30 benchmarks named most often in launch posts are past 85%, and 12 are past 95%.
- Nearly every benchmark correlates with every other (median rank correlation 0.67), because most of the variation is one general-capability factor. After controlling for Epoch's Capabilities Index, the median pair falls to 0.06.
- A few benchmarks measure something else, such as hallucination rate, games, GAIA and BullshitBench.
- Clusters are soft. After the general factor, the main split is building and agentic tasks against exams. The almanac's subject areas barely match how benchmarks actually group, and contest coding behaves like math.
Charts: correlations/, saturation/,
clusters/. Full write-up: benchmark-analysis/summary.md.
What the data can't support
- Many "solved" benchmarks rest on labs' own claims. Best scores mix harnesses, tool use, best-of-n and launch-post self-reports. Counting only independent runs, SatBench is at 24%, not 63%. Three in four first crossings past 85% come from the lab's own launch post, and only 10 of those 75 were later matched by an independent run.
- Before 2025 the data is thin. There are only 43 launch posts from 2023-24, against about 230 a year since, so treat early numbers as rough.
- The score grid is sparse. Most models are not scored on most benchmarks (the cluster analysis works with a matrix that is 40% filled), and boards use different harnesses.
- Recent benchmarks are undercounted. A benchmark enters SatBench only after 10 launch-post mentions, which takes months, so 2026 releases, mostly unsolved, are not yet all counted.
- The projections assume the remaining benchmarks are no harder than the ones already solved.
Each summary.md lists more caveats, and SatBench's lists possible data errors in the almanac worth checking.
Reproducing
pip install -r requirements.txt
satbench/scripts/run.sh
benchmark-analysis/scripts/run.sh
Each run.sh clones the almanac at the commit its charts used, dumps the site's data layer with Node 22.18+,
and redraws the charts in place. Rerun at those commits, the charts match the published images. See the
scripts/README.md in each folder for details.
Data and licenses
This repository contains no almanac data. The almanac's code is MIT-licensed, but its data has no single license: each source keeps its own terms, and some are non-commercial (the SWE-bench boards are CC BY-NC 4.0 and MathArena's datasets CC BY-NC-SA 4.0). The scripts download the data from the almanac instead of redistributing it. See the almanac's License section before reusing any derived data.
Credits: data from the Benchmark Almanac by Brian Zhou, including the Epoch AI Benchmarking Hub (CC BY 4.0), official leaderboards (each board's makers), and AI labs' launch posts. Artificial Analysis scores are not included, because of its terms.
The analysis, charts and code in this repository are released under CC0 1.0.
satbench/summary.md
SatBench: a benchmark whose questions are benchmarks
Data: Benchmark Almanac (benchmarkalmanac.com), read through the site's own TypeScript data layer, so every number matches the site. Includes Epoch AI's Benchmarking Hub (CC BY 4.0). Data as of Nov 14, 2026.
The definition
- Items ("questions"): the 173 benchmarks named in 10 or more AI lab launch posts that are scored in percent, where higher is better. Each version counts as its own item, so AIME 2024 and AIME 2025 are two items. This is the same set the earlier saturation work used (it had 172; one more benchmark has since reached 10 posts).
- An item is solved once the best score anyone has reported for it reaches 85%. That score can come from an official leaderboard, from Epoch AI, or from a lab's own launch post. This uses the site's own
frontierand its 85% threshold. - SatBench score is the share of items solved.
- SatBench-live adds each benchmark when it is released. It answers: of the benchmarks that exist, how many are beaten?
- The fixed editions (SatBench-2023, -2024, -2025) freeze the item set at the end of that year, the way an exam does.
- Kill: the model whose score first took an item past 85%.
- Born solved: an item that a model had already passed 85% on before the benchmark came out. There are 9, such as new AIME and HMMT years.
Headline results
-
SatBench stands at 109 of 173, or 63%.
- It sat near 30% from 2023 to early 2025, while new benchmarks arrived about as fast as old ones fell: 30% in Jan 2024 and 31% in Jan 2025.
- Then it climbed: 46% in Jan 2026, past 50% in Mar 2026, and 63% now. That is +20 points in 12 months.
-
The benchmark of benchmarks has saturated its own first edition. SatBench-2023 has 44 items and is at 86%; it crossed 85% in Sep 2026. SatBench-2024 is at 78% and SatBench-2025 at 69%. At their freeze dates the three stood at 32%, 34% and 47%.
-
The rise does not depend on the definition, but the level does. Today's level ranges from 24% to 82% depending on the choice. Every version is flat through 2024 and climbs in 2025-26.
Variant Today Solved at 75% 82% Solved at 85% (default) 63% Solved at 95% 25% Independent runs only (no lab claims) 24% Items with 3+ launch-post mentions 47% Items with 20+ launch-post mentions 72% -
Labs keep moving to new tests, so the benchmarks they report stay about half unsolved. The "working set" is every benchmark named in 2 or more launch posts in the trailing 6 months, which uses no hindsight.
- Its solved share was 47-60% through 2024.
- Since mid-2025 it has stayed at 41-47%, and it is 45% today (106 of 236).
- The stock of benchmarks is being used up, but labs swap in harder tests about as fast as they beat the old ones.
-
Launch posts headline fewer already-saturated tests. The share of a post's benchmarks that were already past 85% before the post went out:
- All labs: 48% in 2025 and 39% in 2026.
- Frontier labs: about 32-42% through mid-2026, then 22% so far in 2026 Q4.
- In 2026 OpenAI was lowest (24%), Anthropic was at 30%, Google at 41%, and some smaller labs above 50%.
- GPQA Diamond still appeared in 102 launch posts in 2026, every one of them after it passed 85%.
-
Benchmarks are falling faster. The Kaplan-Meier median time from release to 85% is:
- 19.5 months for 2023 and 2024 releases;
- 13.7 months for 2025 releases (the upper bound of the confidence interval is still open);
- not yet reached for 2026 releases.
The share solved within 12 months went from 17% to 30% to 43% for the 2023, 2024 and 2025 cohorts, which matches the earlier analysis. Of the 43 items past 95%, the median time from 85% to 95% was 6.5 months. Most items past 85% have not reached 95%.
-
By area: reasoning is 80% solved and knowledge 79%, then multimodal 66%, code 55%, agents 45% and work 18%. Agents and work make up most of the newest tests. Once an agents test is a year old, it falls as fast as any other area's.
Who solves SatBench
- Raw kills, not counting born-solved items: OpenAI 24, Google 19, Qwen 17, Anthropic 14, ByteDance Seed 6, Meta 4. Z.ai, Mistral, NVIDIA and Liquid AI have none, despite 10 or more launch posts each.
- Raw kills mislead, and Qwen is the clearest case. A kill means the first recorded score past 85%. On a benchmark that frontier labs never run, any model that reports it gets the credit, even if other models could have scored higher.
- Qwen's launch posts list far more benchmarks than anyone else's: 137 of the 173 items.
- The median Qwen-killed benchmark gets 65% of all its launch-post mentions from Qwen itself. For OpenAI, Google and Anthropic the figure is 7-14%.
- Examples: MAXIFE (11 of 11 mentions are Qwen's), SLAKE (10 of 10), MLVU (17 of 21).
- The previous best was usually Qwen's own earlier model.
- Five of the kills come from one Feb 2026 Qwen3.5 post, all self-reported.
- Contested kills are the better measure. These count only benchmarks that other frontier labs also report, in at least 5 of their launch posts.
- OpenAI 20, Google 14, Anthropic 14, then Qwen, ByteDance and Meta with 4 each. 71 of the 100 kills qualify.
- At a bar of 3+ mentions Qwen has 7; at 10+ it has 0. The top three stay the same at every bar.
- In 2026, Anthropic has 11 of the contested kills, Google 3 and OpenAI 2.
- Qwen's one contested kill in 2026 is MRCR v2. That is a self-reported 90.4 against Gemini 3.1 Pro's 84.9, and MRCR v2 has several context-length variants, so the two numbers may not be comparable.
- Adjusting for how much each lab reports changes the order.
- Per 10 launch posts: Anthropic 5.8, OpenAI 4.7, ByteDance 4.0, Qwen 3.8, Google 3.3.
- Per 100 SatBench items the lab ever named: OpenAI 34, Anthropic 25, Google 22, Qwen 12. Qwen names 137 of the 173 items.
- Three in four kills are a lab grading its own model.
- 75 of 100 first crossings come from the lab's own launch post. That share was 81% in 2026.
- Only 10 of those 75 were later matched by an independent run of 85% or more.
- This is partly built in: a launch-day claim almost always comes before any outside run.
The holdouts (64 unsolved)
- The most-cited ones are:
- Humanity's Last Exam (74.2, a with-tools lab claim; the site's independent board best is 54.8);
- MMMU-Pro (84.6), IFBench (82.9), Terminal-Bench 2.0 (84.7), DeepSWE (79.0), AutomationBench (76.1), SciCode (59.8).
- 13 of the 64 are at 82 or above. Four are within half a point of 85: LiveBench, TextVQA, Terminal-Bench 2.0 and MMMU-Pro.
- Most still move. The median 12-month gain among the top 14 was +12.6 points.
- Some holdouts are abandoned rather than hard.
- 21 have had no new best in 6 or more months, and 14 of those are fading or dropped from launch posts. Examples are LiveCodeBench v5 and the original tau-bench.
- HealthBench (67.2 since Aug 2025) is still in use but stalled.
- Some may have a ceiling below 100%.
- An audit (FutureHouse) disputes about 29% of HLE's chemistry and biology answers.
- Prime Intellect found grader bugs in AutomationBench.
- Epoch puts FrontierMath's ceiling at 57; the best score is 52.4.
Projection (if 2026 rates hold; not a forecast)
- Over the last 12 months, an unsolved item had about a 5% chance per month of being solved (43 crossings in 858 item-months; 10-90% range 4.1-6.0%).
- Today's fixed set of 173 items would reach 85% solved (SatBench itself saturated) around May 2028 (80% range Jan to Nov 2028). Using the 6-month, 24-month or 2025 rate instead gives Aug to Oct 2028.
- SatBench-live climbs much more slowly, because new unsolved tests keep arriving. This assumes the 2025 rate of 4.7 new items a month, 9% of them born solved.
- It reaches about 73% by the end of 2028.
- It would not reach 85% until about 2033 (range 2031-2036).
- It is a treadmill.
- The model's main weakness: it assumes the remaining items are no harder than the ones already solved, and that new tests are not built to resist.
When do we run out of benchmarks?
There are 64 unsolved items today. At the last 12 months' rate, each has about a 5% chance per month of being solved. I simulated two paths:
- If nobody made a new benchmark after today: the last of the 64 falls around 2034 (80% range 2031-2037). 95% would be solved well before then.
- If new benchmarks keep coming at the 2025 pace (4.7 a month) and AI keeps speeding up (the solve rate rising 1 point a year, as it did from 2024 to 2026): the unsolved count falls to about 34 by 2034. It still doesn't reach zero.
- Without the speed-up, the count would level off around 85, roughly new benchmarks per month divided by the solve rate. The chart leaves this path out.
When SatBench itself saturates (85% of items solved):
- Today's fixed set: around mid-2028.
- With new benchmarks arriving and solving rates continuing to speed up: around mid-2030 (80% range mid-2029 to mid-2031).
The share-ready chart is titled "When will SatBench be Saturated?".
Why the unsolved count rises and then falls.
- 2023-2025, rising: new benchmarks came faster than models solved them. 18 entered in 2023 against 10 solved; 44 in 2024 against 16; 56 in 2025 against 38.
- 2026, falling: 41 benchmarks were solved but only 29 new ones are counted. Most of that gap is a counting lag. A benchmark enters SatBench only once it has 10 launch-post mentions, which took 2025 releases a median of about 9 months, so few 2026 releases count yet.
- Adjusted: at the 2025 arrival pace, the unsolved count would be about 83 today, roughly flat, instead of 64. The chart shows this as a dotted line.
So we only run out of benchmarks if people stop making them. The real constraint is whether new tests can stay hard. The share of new benchmarks that are already solved at release is rising: 0% for 2023 releases, 2% for 2024, 7% for 2025 and 14% for 2026.
What the data cannot support
- Many "solved" items rest only on labs' own claims. Best scores mix harnesses, tool use, best-of-n and lab self-reports. With independent runs only, SatBench is 24%, not 63%.
- 44 items have no independent runs at all.
- Among the 129 that do, the independent-only score is 33%, against 60% from all sources.
- Part of the last year's jump comes from new benchmarks not yet counting. A benchmark needs time to reach 10 launch-post mentions: 2025 releases took a median of 8.7 months. So 2026 releases are under-counted, and they are mostly unsolved.
- With about 20 more unsolved 2026 items, the live score would be about 57%, not 63%.
- The fixed 2025 edition is the cleanest measure of speed. It went from 47% to 69% during 2026.
- The 2023-24 numbers are rough. There are only 43 launch posts from those two years, against about 230 a year since.
- Some crossings are dated before the benchmark existed (9 born-solved items), because scores are dated by model release rather than by when the test was run.
- The index gives every item the same weight. Weighting by mentions raises the level (items with 20+ mentions: 72%).
Data issues worth checking (possible errors in the almanac)
- Crossings dated before the benchmark's release:
- AIME 2026, by Qwen3-30B-A3B-Thinking (Jul 2025, 88.3); a 30B model going first is suspicious.
- HMMT Nov 2025 (grok-4), HMMT 2026 (Gemini 3 Pro), tau3-bench (Claude Opus 4.5), PinchBench (Gemini 3 Flash), RULER (Command R).
- OSWorld 2.0: the leaderboard tops out at 20.6. Lab launch posts then report 62.6 to 77.9, probably a different variant or harness.
- Lab claims far above an independent run of the same model:
- Chartography: Claude Opus 5.5 claims 89.0; an independent run gives 66.3.
- GDP-PDF: Claude Fable 5.1 claims 85.4; an independent run gives 49.4.
- SimpleQA's "kill" is Perplexity Sonar Pro (85.8), which answers with web search, not closed-book.
- Mismatched fields and labels:
- For onemillion-bench,
best(42.1) does not match the end of itsfrontier(68.8). - PMC-VQA is filed under "work", and LiveBench under "other".
- Two kill models have no lab in models.json: palm-2-l and minicpm-v-2-6.
- For onemillion-bench,
Files
-
Share-ready (
share/):satbench_summary_card.png: one-image summary.satbench_leaderboard.png: lab leaderboard.satbench_by_year.png: how fast each year's new benchmarks are solved.satbench_run_out.png: when we run out of benchmarks.
-
Index (
index/):satbench_hero.png: the live index and the fixed editions.satbench_robustness.png: the index under the other definitions above.satbench_working_set.png: the working set against the live index.satbench_projection.png: the projections.satbench_by_area.png: solved share by area.
-
Items (
items/):scorecard.png: the 109/173 card.holdouts.png: the most-cited unsolved items.half_life_by_cohort.png: time to 85% by release year.areas.png: solved and unsolved items per area.
-
Labs (
labs/):labs_kills_contested.png: the best version of the lab ranking; it counts only benchmarks other frontier labs also report.labs_kills_by_lab.png,labs_kills_source.png,labs_kills_normalized.png,labs_kills95.png,labs_top_models.png: who solved what, from which source, and adjusted for reporting volume.labs_headline_saturation_2026.png,labs_headline_saturation_quarterly.png: how many already-saturated tests labs put in launch posts.
-
Scripts (
scripts/):common.pyholds the definition. The.mtsand.mjsfiles dump the site's data layer, andrun.shrebuilds every chart.
benchmark-analysis/summary.md
Benchmark Almanac analysis: correlations, saturation, clusters
All numbers come from the almanac's own data layer: its TypeScript benchSummary(), dumped as is, so they match benchmarkalmanac.com. Data as of Nov 14, 2026.
Sources: official leaderboards, Epoch AI's Benchmarking Hub (CC BY 4.0), and labs' launch posts. Artificial Analysis scores are not included, because of its terms.
Scripts: scripts/, one folder per analysis plus the shared common.py. scripts/run.sh rebuilds every chart from the almanac.
1. Correlations (correlations/)
Set: 43 widely used capability benchmarks, one version per family, with no safety tests. A pair is only scored when at least 15 models have results on both benchmarks. 767 of the 903 pairs meet that bar, with a median overlap of 35 models.
Findings:
- Nearly everything correlates. The median Spearman correlation is 0.67, 76% of pairs are above 0.5, and only 13 pairs are negative. GPQA Diamond and OTIS Mock AIME correlate at 0.96 across 206 models.
- Most of that is one general-capability factor. The control here is the Epoch Capabilities Index (ECI).
- After controlling for ECI, the median pair falls to 0.06, and only 36 of 724 pairs stay above 0.5.
- Controlling for release date instead leaves a median of 0.52.
- Area labels barely matter. Pairs in the same area average 0.64, and pairs across areas average 0.62.
- Pairs that stay linked beyond general capability:
- LMArena text and Vision Arena: 0.90 (same platform).
- SimpleQA Verified with SimpleBench (0.79) and with GPQA (0.74). This looks like a "knows facts" factor.
- OTIS and MATH Level 5: 0.67.
- The two chess benchmarks: 0.54.
- LegalBench and MedCode: 0.54 (same evaluator).
- The most independent benchmarks are Vectara hallucination, SnakeBench, GAIA and BullshitBench V2.
- Their correlations with ECI are 0.33, 0.53, 0.55 and 0.62.
- On BullshitBench, models that all score above 85% on GPQA range from 10% to 95%.
Caveats:
- ECI is partly built from 14 of the 43 benchmarks. That flatters their fit to ECI.
- At about 30 shared models, a controlled correlation is uncertain by roughly ±0.2.
- Boards use different harnesses, and some come from lab claims.
2. Saturation and extinction (saturation/)
Definitions:
- Saturation uses the site's thresholds: the best reported score from any source passes 85%, then 95%.
- Extinct: a benchmark family (versions merged, so AIME 2024 to AIME 2025 is not an extinction) that meets both conditions:
- it was named in at least 10% of all launch posts, and in at least 10% of frontier-lab posts, in some period;
- it was then named in at most one frontier-lab launch post in the last 6 months.
- Frontier labs: Anthropic, OpenAI, Google, Moonshot, Meta, DeepSeek, xAI, Qwen and Z.ai.
Findings:
- Most of the top benchmarks are saturated. 24 of the 30 benchmarks named most often in launch posts are past 85%, and 12 are past 95%.
- Still below 85%: HLE (74%), MMMU-Pro, Terminal-Bench 2.0, IFBench, AutomationBench and DeepSWE.
- ARC-AGI-2 went from 6.5% (Apr 2025) to 95% (Sep 2026).
- Newer benchmarks are beaten faster. This is a Kaplan-Meier estimate over 172 benchmarks named in 10 or more launch posts.
- The share past 85% within a year of release was 17% for 2023 releases, 30% for 2024 and 44% for 2025.
- Within 6 months, 36% of 2026 releases are already past 85%.
- 8 benchmarks were already at 85% when released, among them AIME 2025 and 2026, and HMMT 2026.
- The 2023 canon is extinct at the frontier. The canon is MMLU, HumanEval, GSM8K, MATH, BBH, HellaSwag, DROP and MGSM.
- Every one of the 34 frontier-lab posts from 2023-24 named at least one of them.
- In 2026, only 2 of 134 did, and both were DeepSeek base-model tables.
- Benchmarks are saturated first and dropped second. 32 families qualify as extinct, and 28 of them were past 85% when frontier labs last named them.
- The long tail keeps a few alive, but only barely. In 2026, MMLU appeared in 1 of 134 frontier-lab posts and 5 of 114 other-lab posts.
- Next to go: SWE-bench Verified fell from 57% of frontier-lab posts to 1.7%. The AIME family fell from 65% to 1.7%, and MMLU-Pro from 34% to 1.7%.
Caveats:
- 2023-24 rests on only 43 launch posts, so treat that period as rough.
- Best scores mix harnesses, tool use and lab claims.
- The pre-2023 group suffers from survivorship, so its slowness is overstated. The 2023, 2024 and 2025 groups compare fairly with each other.
3. Clusters / PCA (clusters/)
Core data: 125 benchmarks × 146 models, 40% filled, rank-normalized.
Method:
- The model is a low-rank factor model fitted only to observed cells, with its size chosen by cross-validation.
- The result was checked against soft-impute PCA (r = 0.85 on component 2), against pairwise residual correlations (r = 0.79), and against a refit on post-July-2025 models only (r = 0.94 and 0.87 on components 2 and 3).
Findings:
- One factor dominates. It is 82% of the signal and tracks release date (Spearman 0.81). On its own it predicts 61% of held-out scores, against 68% for all 10 components.
- Component 2 (5.6%) is "building vs exams". On one side are app-building and agentic boards (DesignArena, SWE-bench Verified, APEX-SWE). On the other are exams (AIME, SMT, BRUMO, MMLU-Pro).
- Component 3 (2.6%) runs from games, long context and recall to human preference and writing.
- Clusters are soft.
- Silhouette is 0.04 to 0.06 for every number of clusters tried.
- When models are resampled, the median adjusted Rand index (ARI) is 0.28.
- The most stable groups are publisher families: Vals agent tasks and DesignArena.
- The almanac's areas barely match the clusters. ARI against area is 0.14, and only 47% of benchmarks sit closest to their own area.
- Contest coding behaves like math. IOI, ALE-Bench, LiveCodeBench and WeirdML group with math benchmarks.
- Lab leanings, after removing overall capability:
- Anthropic leans to building (-0.74 SD) and Google to exams (+0.74).
- OpenAI and Google lean to games and recall.
Caveats:
- Component 2 partly reflects benchmark age: building boards are newer and were scored on newer models (rho -0.63).
- Boards from the same publisher share harnesses, which makes them look more alike.
- Vision is underrepresented in the core.