WeatherNext team / 长帖 / 视频
对小到中雨,PARDIG的小时降水检出技能比IMERG-Final高出30%以上
DeepMind公开SatWeave和PARDIG。前者按小时拼接地球同步卫星云图,后者给出约10公里、15分钟一帧的全球降水图,对小到中雨的小时检出技能比IMERG-Final高出30%以上。
乔木改写
对小到中雨,PARDIG的小时降水检出技能比NASA的IMERG-Final高出**30%**以上。这是Google DeepMind WeatherNext团队在2026年11月13日的说明里给出的对比,评测期是2016年到2023年,对照的是美国、欧洲和日本的地面雷达网。
他们同时公开了SatWeave和PARDIG两套基础数据集,供研究者和开发者做天气、水文和气候应用。两套数据都被写成最近发布的WeatherNext 3能往前走的关键输入:SatWeave是地球同步卫星影像的全球拼接,给模型看正在发展的云和风暴;PARDIG是一套AI全球降水数据,曾用来训练该模型的降水预报。历史存档和实时源一并开放。官方还配了一张分层地球的题图,把卫星影像和降水网格画在一起。

媒体未能载入,请通过下方原文链接查看。
把天上已经在测的东西,及时收成一张能用的全球图,本身就是科学和工程问题。卫星和地面仪器一直在密集观测,难的是把不同来源拼成一幅连贯的全球图,并尽快提供出去。
正文点名五颗卫星,图注里写的是六颗
SatWeave要拼的,是覆盖地球不同区域的卫星影像。正文列出的是五颗:GOES-East、GOES-West、Meteosat 0、Meteosat Indian Ocean,以及Himawari。它们的地图投影、文件格式、传感器和扫描周期并不一样,扫描间隔从10分钟到30分钟不等,所以很难合成一张干净的全球图。作者写,现有的大多数全球合成会丢掉对不上的部分,往往只提供四个或更少的通道,或者每隔几小时才更新一次。
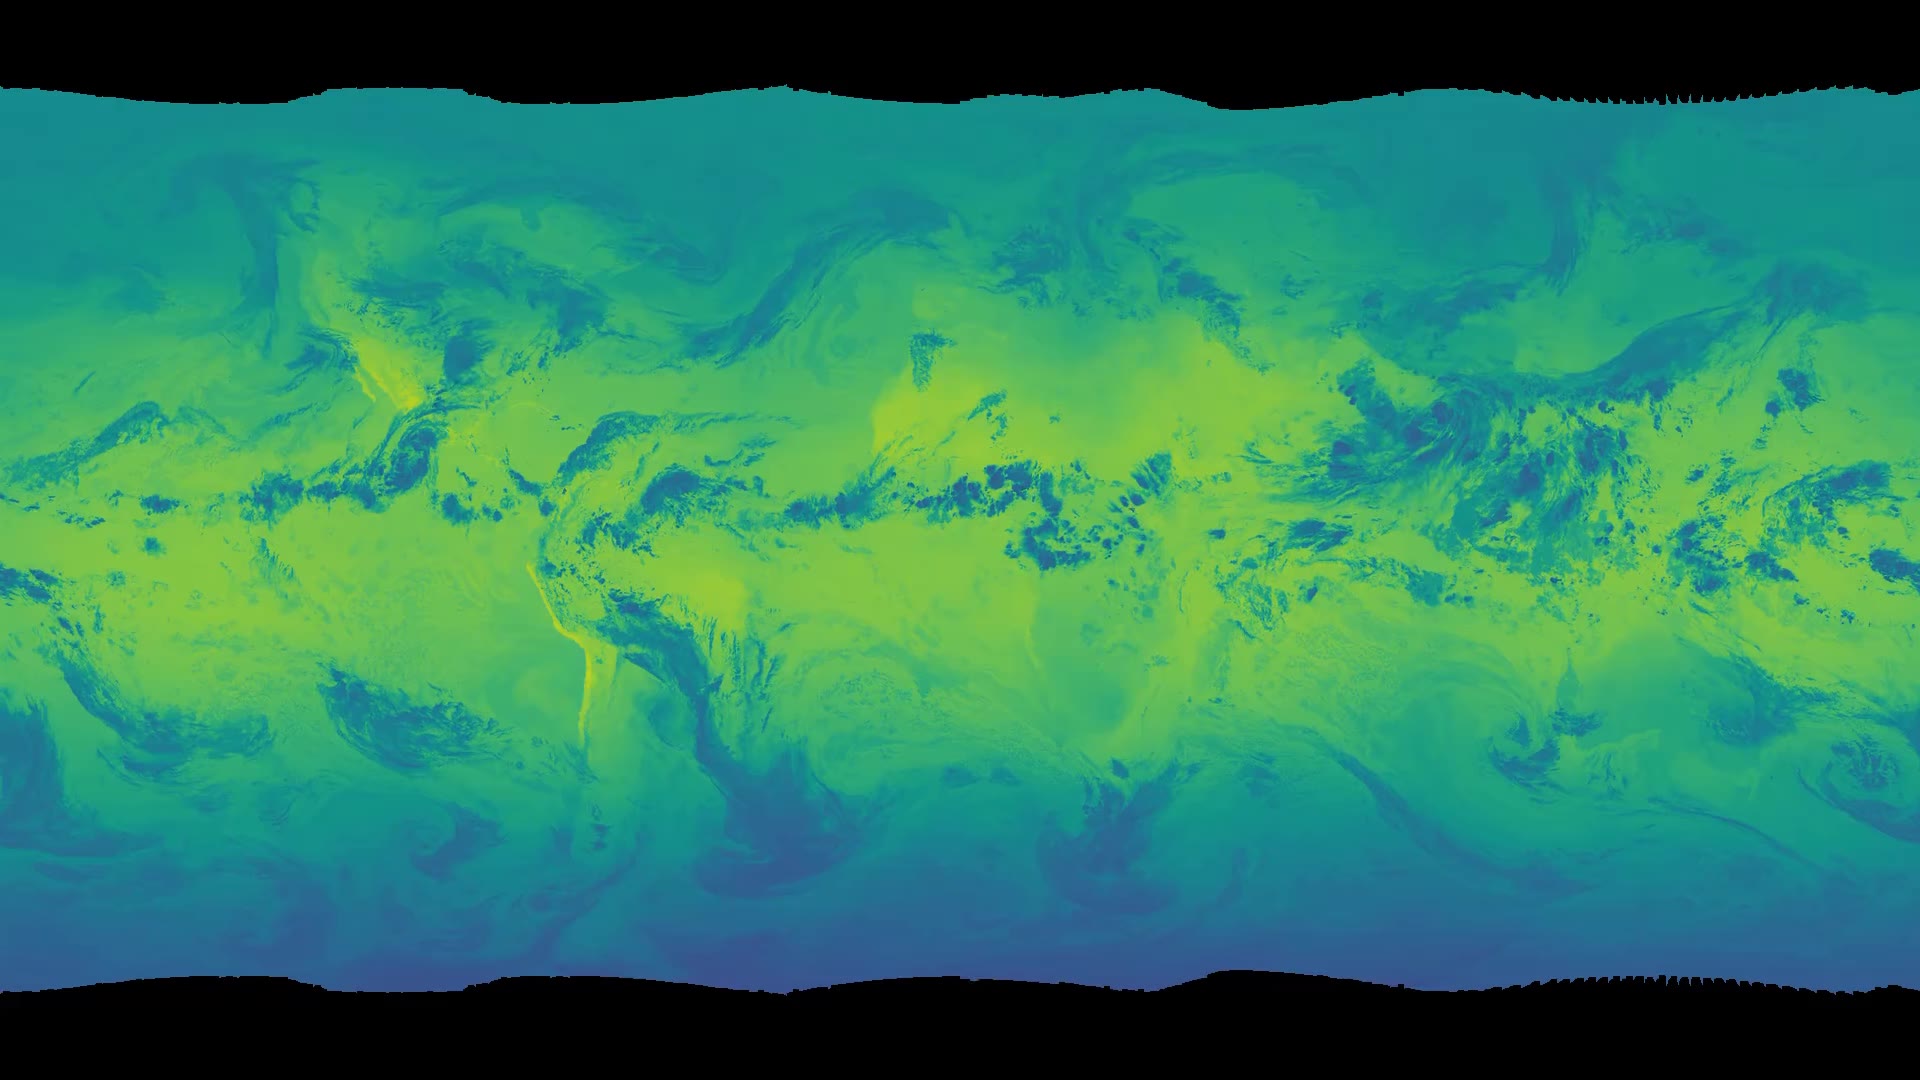
官方配了一段视频,图注写:SatWeave把六颗地球同步卫星的观测,拼成覆盖17个可见光、水汽和红外通道的全球拼接图。正文写五颗,图注写六颗,这里按原文分开保留,不自行改成同一个数字。官网页面只用了通用占位封面。这里的封面同样取自官方视频约0.1秒处的首帧,画面是一幅全球伪彩色拼接。没有官方逐镜说明,本文没有把整段视频写成已完整观看,理解和引用以这段图注为准。
媒体未能载入,请通过下方原文链接查看。
SatWeave按小时更新,WeatherNext 3因此可以给出新的全球预测;相比之下,用分析场初始化的模式,分析场往往每6小时才更新一次。他们同时发布这个按小时更新的实时源,以及跨度超过十年的历史存档。
SatWeave已经用在WeatherNext 3的中期天气预报里。太阳能和野火监测被写成他们希望与研究及开发社区一起探索的方向,不是本文的复测结果。
15分钟一张全球雨图,空间尺度大约10公里,平均晚大约5小时
降水关系到食物、供水,也关系到洪水和干旱风险,但要在全球范围内准确追踪,仍然很难。地面雷达和密集雨量站能提供高质量数据,却不是每个地区都有,覆盖也不总是够好。
PARDIG的全称是Precipitation AI Reanalysis: Densely Inferred GPM。它的AI架构和WeatherNext 3相近,直接在NASA全球降水测量计划核心观测卫星那套稀疏星载雷达观测上训练,输入还包括SatWeave影像和ECMWF的大气场。官方给出的结果是:一张高精度的全球降水图,时间分辨率15分钟,空间分辨率大约10公里,平均延迟大约5小时。
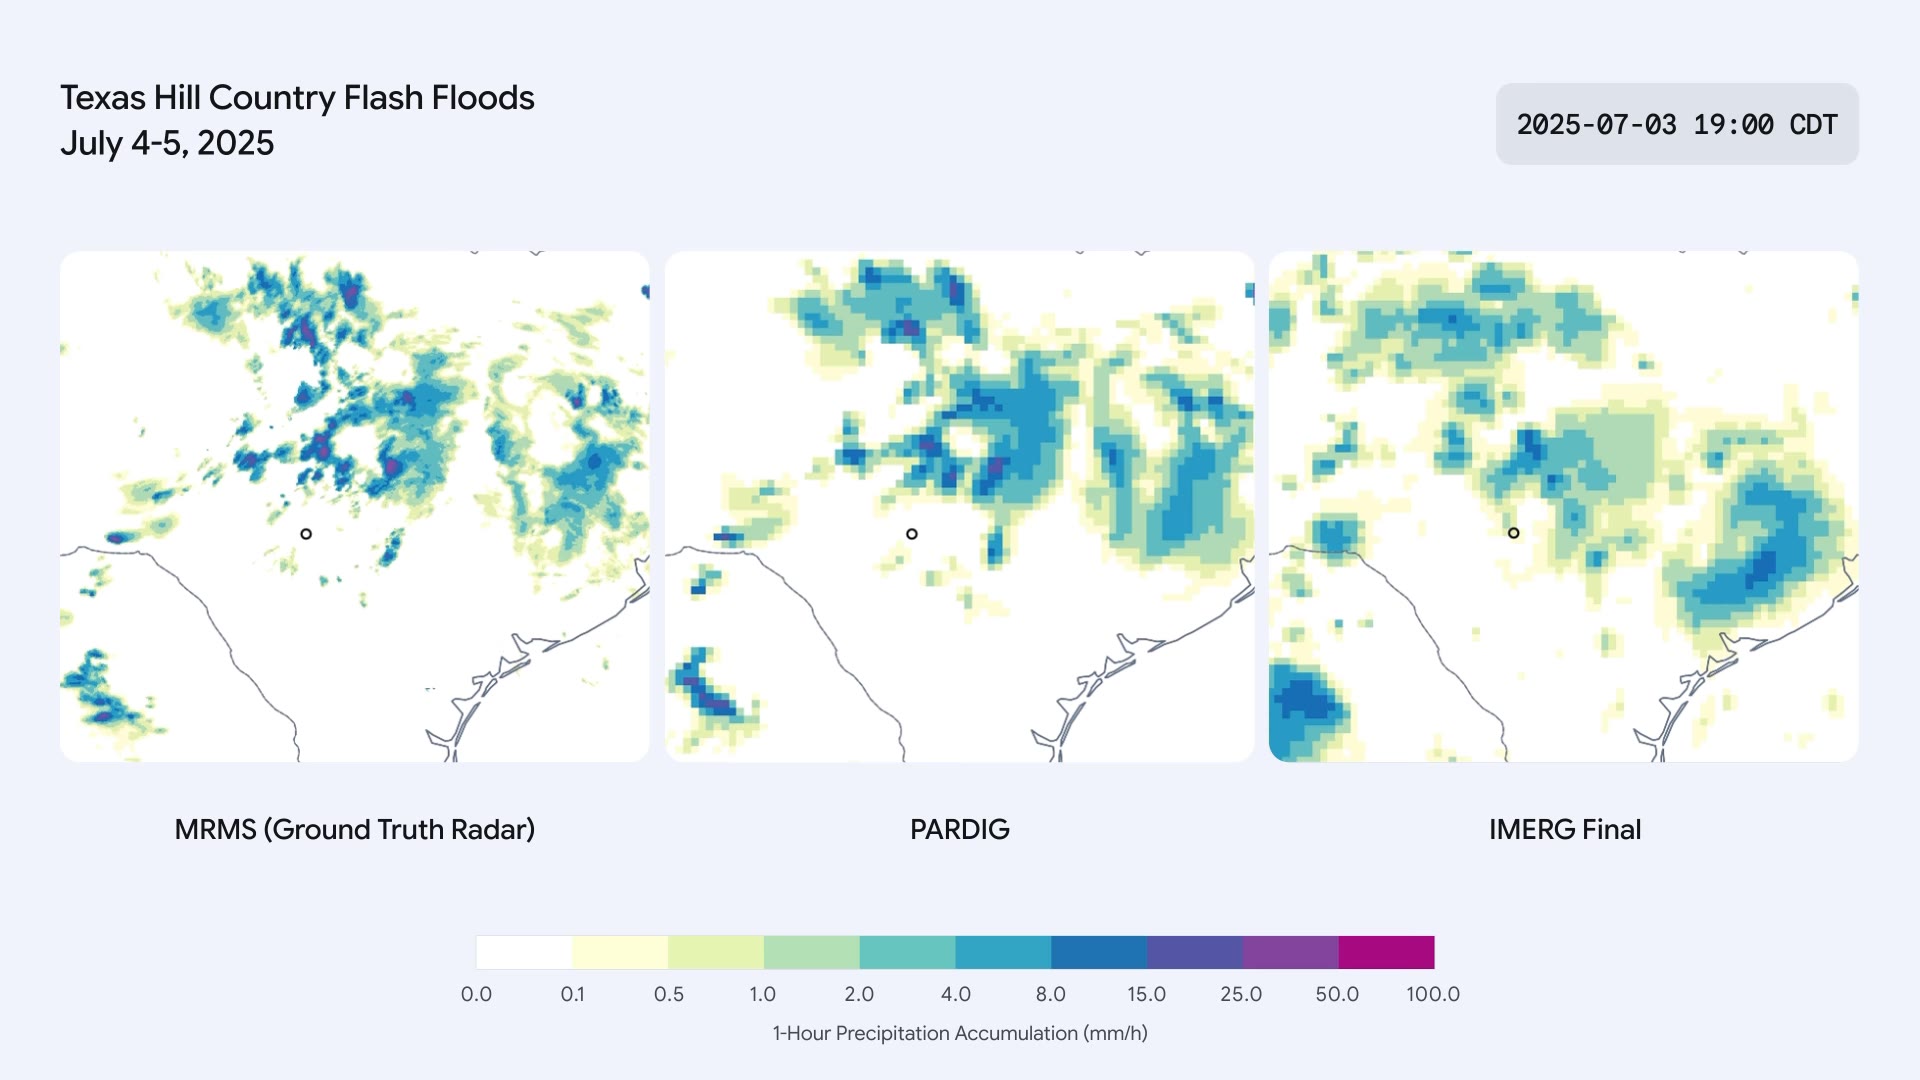
官方另有一段视频,图注写的是2025年7月得克萨斯州Hill Country暴洪期间的小时降雨对比:左侧是地面NOAA MRMS雷达,尺度大约1公里;中间是近实时的PARDIG,大约10公里;右侧是IMERG-Final,也是大约10公里。官网页面只用了通用占位封面,没有单独的内容封面。这里的封面是从官方视频约0.1秒处截取的首帧:标题写Texas Hill Country Flash Floods, July 4-5, 2025,时间戳是2025-07-03 19:00 CDT,三幅图分别标为MRMS (Ground Truth Radar)、PARDIG和IMERG Final,色标是1-Hour Precipitation Accumulation,单位毫米/小时。这只是首帧上能看到的字,不是整段视频的逐镜转写。
媒体未能载入,请通过下方原文链接查看。
他们把PARDIG拿到美国、欧洲和日本三套大陆尺度雷达网,以及全球超过36000个气象站上做了评测。官方写,在所有分析过的雨强上,PARDIG都超过了主要的全球基线,其中包括NASA的IMERG-Final。IMERG-Final被写成一套研究级降水估计产品,对许多应用都很重要。对小到中雨,PARDIG的小时降水检出技能比IMERG-Final高出**30%**以上。作者还写,它在捕捉极端降水时尤其有效,而现有全球产品在这一点上往往比较吃力。这些对比来自官方评测,不是本文复跑。
配图是三张检出技能曲线,指标是Critical Success Index,也就是临界成功指数。评测期是2016年到2023年,对照的仍是美、欧、日的地面雷达网。雨强阈值按对数坐标画在0.2到25毫米/小时之间,图上标出的三档是小雨0.3毫米/小时、中雨2.5毫米/小时、大雨20毫米/小时。官方替代文本写,在这三个地区,近实时的PARDIG都高于IMERG-Final和IMERG-Early。正文没有再给出这些曲线上的逐点读数,这里只按官方图题和替代文本来放置。

媒体未能载入,请通过下方原文链接查看。
因为PARDIG直接从卫星学习,并不只靠地面测量,作者预期它在没有这些地面测量的地方,也能保持可靠精度。这是他们的预期,不是在所有缺测地区完成的独立复验。
和实时源一起公开的,还有PARDIG从1999年到2026年的历史存档。WeatherNext 3已经把它用于中期天气预报。洪水、滑坡和干旱,尤其是没有密集地面雷达的地区,被写成他们希望和社区一起改进模型的方向。
实时和历史数据放在云存储和地球引擎上
SatWeave和PARDIG的实时与历史数据,现在都可以在Google Cloud Storage上公开获取。PARDIG的历史目录也进了Google Earth Engine。官方把它写成Google Earth AI组合里的新成员,希望研究者用这些数据,把天气观测接到实际应用上。文末“了解更多”指向WeatherNext开发者文档,同一文档也承担“获取历史数据和实时数据”的入口,另外还有PARDIG研究论文,以及Earth Engine上的PARDIG历史存档入口。Earth Engine这条链到的是地球引擎首页,页面没有给出更细的目录地址。本文没有展开论文正文。
这项工作由Google DeepMind和Google Research的团队完成,并与Google Cloud、Google Geo合作。他们感谢ECMWF、NASA、JAXA、NOAA、EUMETSAT、KMA、JMA、KNMI和Synoptic Data等机构的开放卫星项目与数据。
如果要在自己的天气或水文模型里试用,可以从WeatherNext开发者文档和地球引擎入口开始核对实时源、历史存档和论文。访问方式和当时能拿到的范围,以这些页面为准。文中的检出技能和精度数字,来自官方评测,使用前仍应按自己的区域和雨强再核对。
原文
Opening the datasets behind our AI weather models
媒体未能载入,请通过下方原文链接查看。
媒体未能载入,请通过下方原文链接查看。
媒体未能载入,请通过下方原文链接查看。
媒体未能载入,请通过下方原文链接查看。
Opening the datasets behind our AI weather models
November 13, 2026
Science
WeatherNext team
URL: https://deepmind.google/blog/opening-the-datasets-behind-our-ai-weather-models/
We are releasing PARDIG and SatWeave to help researchers and developers build new weather, hydrology, and climate applications.
Understanding and predicting the planet’s weather and water cycle starts with how well we can observe the Earth right now. Satellites and ground instruments monitor the planet continuously and in great detail. But converting these raw measurements into a coherent global picture and making it available quickly is a major scientific and engineering challenge.
Today, we are releasing two foundational datasets, SatWeave and PARDIG, to support the global community in building weather, hydrology, and climate applications. Both datasets are key to the advances in our recently released WeatherNext 3 model. SatWeave is a global mosaic of geostationary satellite imagery that provides the model a live view of developing clouds and storms. PARDIG is an AI-based global precipitation dataset that was used to train the model’s precipitation forecasts. We are making historical archives and live feeds of both datasets available, so researchers and developers can use them in their modeling and downstream applications.
SatWeave: A unified view of Earth from space
SatWeave combines imagery from five satellites, which cover different parts of the globe: GOES-East and GOES-West, Meteosat 0 and Meteosat Indian Ocean, and Himawari. Because each uses different map projections, file formats, sensors, and scan schedules (ranging from 10 to 30 minutes), it is difficult to form a coherent global map. Most existing global composites drop incompatible aspects, offering only four or fewer channels, or updating every few hours.
SatWeave blends observations from six geostationary satellites into a global mosaic across 17 visible, water vapor, and infrared channels.
The official page used a generic fallback poster (data-poster-is-fallback). The poster stored here is a still taken at about 0.1 seconds from this official webm.
SatWeave updates hourly and thus allows WeatherNext 3 to produce new global predictions, in contrast to models initialized on analysis data refreshed every six hours. We are releasing this hourly live feed, and a historical archive spanning over a decade.
While we have used SatWeave in WeatherNext 3’s medium-range weather forecasts, we're eager to explore forecasting applications such as solar power and wildfire monitoring with the broader research and developer communities.
PARDIG: Accurate, high-resolution precipitation across the globe
Precipitation shapes everything from our food and water supplies to the risk of floods and droughts, yet tracking it accurately across the planet remains a major challenge. While ground radars and dense rain gauge networks provide high-quality data, they aren't always available or have good coverage in all regions.
To help bridge this gap, we developed PARDIG (Precipitation AI Reanalysis: Densely Inferred GPM). Built on an AI architecture similar to WeatherNext 3, PARDIG is trained directly on sparse spaceborne radar observations from the NASA Global Precipitation Measurement (GPM) Core Observatory, using SatWeave imagery and atmospheric fields from ECMWF as inputs. The result is a highly accurate global precipitation map at 15-minute temporal resolution and roughly 10-kilometer resolution, updated with an average latency of about five hours.
Hourly rainfall during the July 2025 Texas Hill Country flash floods, comparing ground-based NOAA MRMS radar (left, ~1 km) with near-real-time PARDIG (center, ~10 km) and IMERG-Final (right, ~10 km).
The official page used a generic fallback poster (data-poster-is-fallback). The poster stored here is a still taken at about 0.1 seconds from this official webm. The first frame shows the title “Texas Hill Country Flash Floods, July 4-5, 2025”, a timestamp “2025-07-03 19:00 CDT”, panel labels “MRMS (Ground Truth Radar)”, “PARDIG”, and “IMERG Final”, and a “1-Hour Precipitation Accumulation (mm/h)” color scale. This describes the first frame, not a shot-by-shot transcript of the full video.
We have performed evaluations of PARDIG against three continental radar networks across the US, Europe, and Japan, as well as over 36,000 weather stations worldwide. PARDIG outperforms leading global baselines across all analyzed rain rates, including NASA’s IMERG-Final, a research-quality dataset of precipitation estimates that is incredibly important for countless applications. PARDIG improves hourly precipitation detection skill over IMERG-Final by more than 30% on light-to-moderate precipitation. It proved particularly effective at capturing extreme precipitation, which can be challenging for existing global products to detect.
Hourly precipitation detection skill (Critical Success Index) evaluated from 2016 to 2023 against ground radar networks in the US, Europe, and Japan. Precipitation intensity thresholds are plotted on a logarithmic scale from 0.2 to 25 mm/h, with Light (0.3 mm/h), Moderate (2.5 mm/h), and Heavy (20 mm/h) marked on the axis.
Because PARDIG learns directly from satellites rather than relying solely on ground-based measurements, we expect it to have reliable accuracy everywhere on Earth, even in areas where these measurements are not available.
Along with the live data feed, we are releasing historical archives of PARDIG data from 1999 to 2026. While WeatherNext 3 used PARDIG for medium-range weather forecasting, we're excited to partner with, and enable, the community in exploring improved models for floods, landslides, and drought, especially in regions without dense ground radar networks.
Empowering the weather and climate ecosystem
The SatWeave and PARDIG live and historical datasets are now openly available on Google Cloud Storage. PARDIG’s historical catalogs are also available in Google Earth Engine. As the latest addition to Google’s Earth AI portfolio, we hope these datasets empower researchers around the world to open new ways of connecting weather observations to crucial, real-world applications.
Learn more
- WeatherNext developer documentation
- Access historical data and real-time
- Read the PARDIG research paper
- Access PARDIG historical archive
Acknowledgements
This work was developed by teams across Google DeepMind and Google Research, in collaboration with Google Cloud and Google Geo. We thank the organizations whose open satellite programs and datasets make this work possible, including ECMWF, NASA, JAXA, NOAA, EUMETSAT, KMA, JMA, KNMI, and Synoptic Data.